
Can’t Find Parking in EPA? New Data Confirms You’re Not Alone
East Palo Alto’s streets are over-parked, with many neighborhoods exceeding 100% occupancy. Our drone study shows the crisis is structural, not anecdotal—and urgent action is needed.
Executive Summary
East Palo Alto public streets are parked at around 84% parking occupancy. This means that as an example, if a street segment has the capacity to park 100 cars, on average we observed 84 cars between 9pm - 10pm. The West Side and Kavanaugh neighborhoods exceed 100% on-street parking occupancy; the street parking problem has gotten so bad that people have been parking illegally perpendicular to the street, parking on sidewalks, and using trash cans to save a spot for themselves. University Village and the University corridor are nearly fully parked at 96% occupancy. Moreover, the parking counts we collected likely underestimate the true parking occupancy.
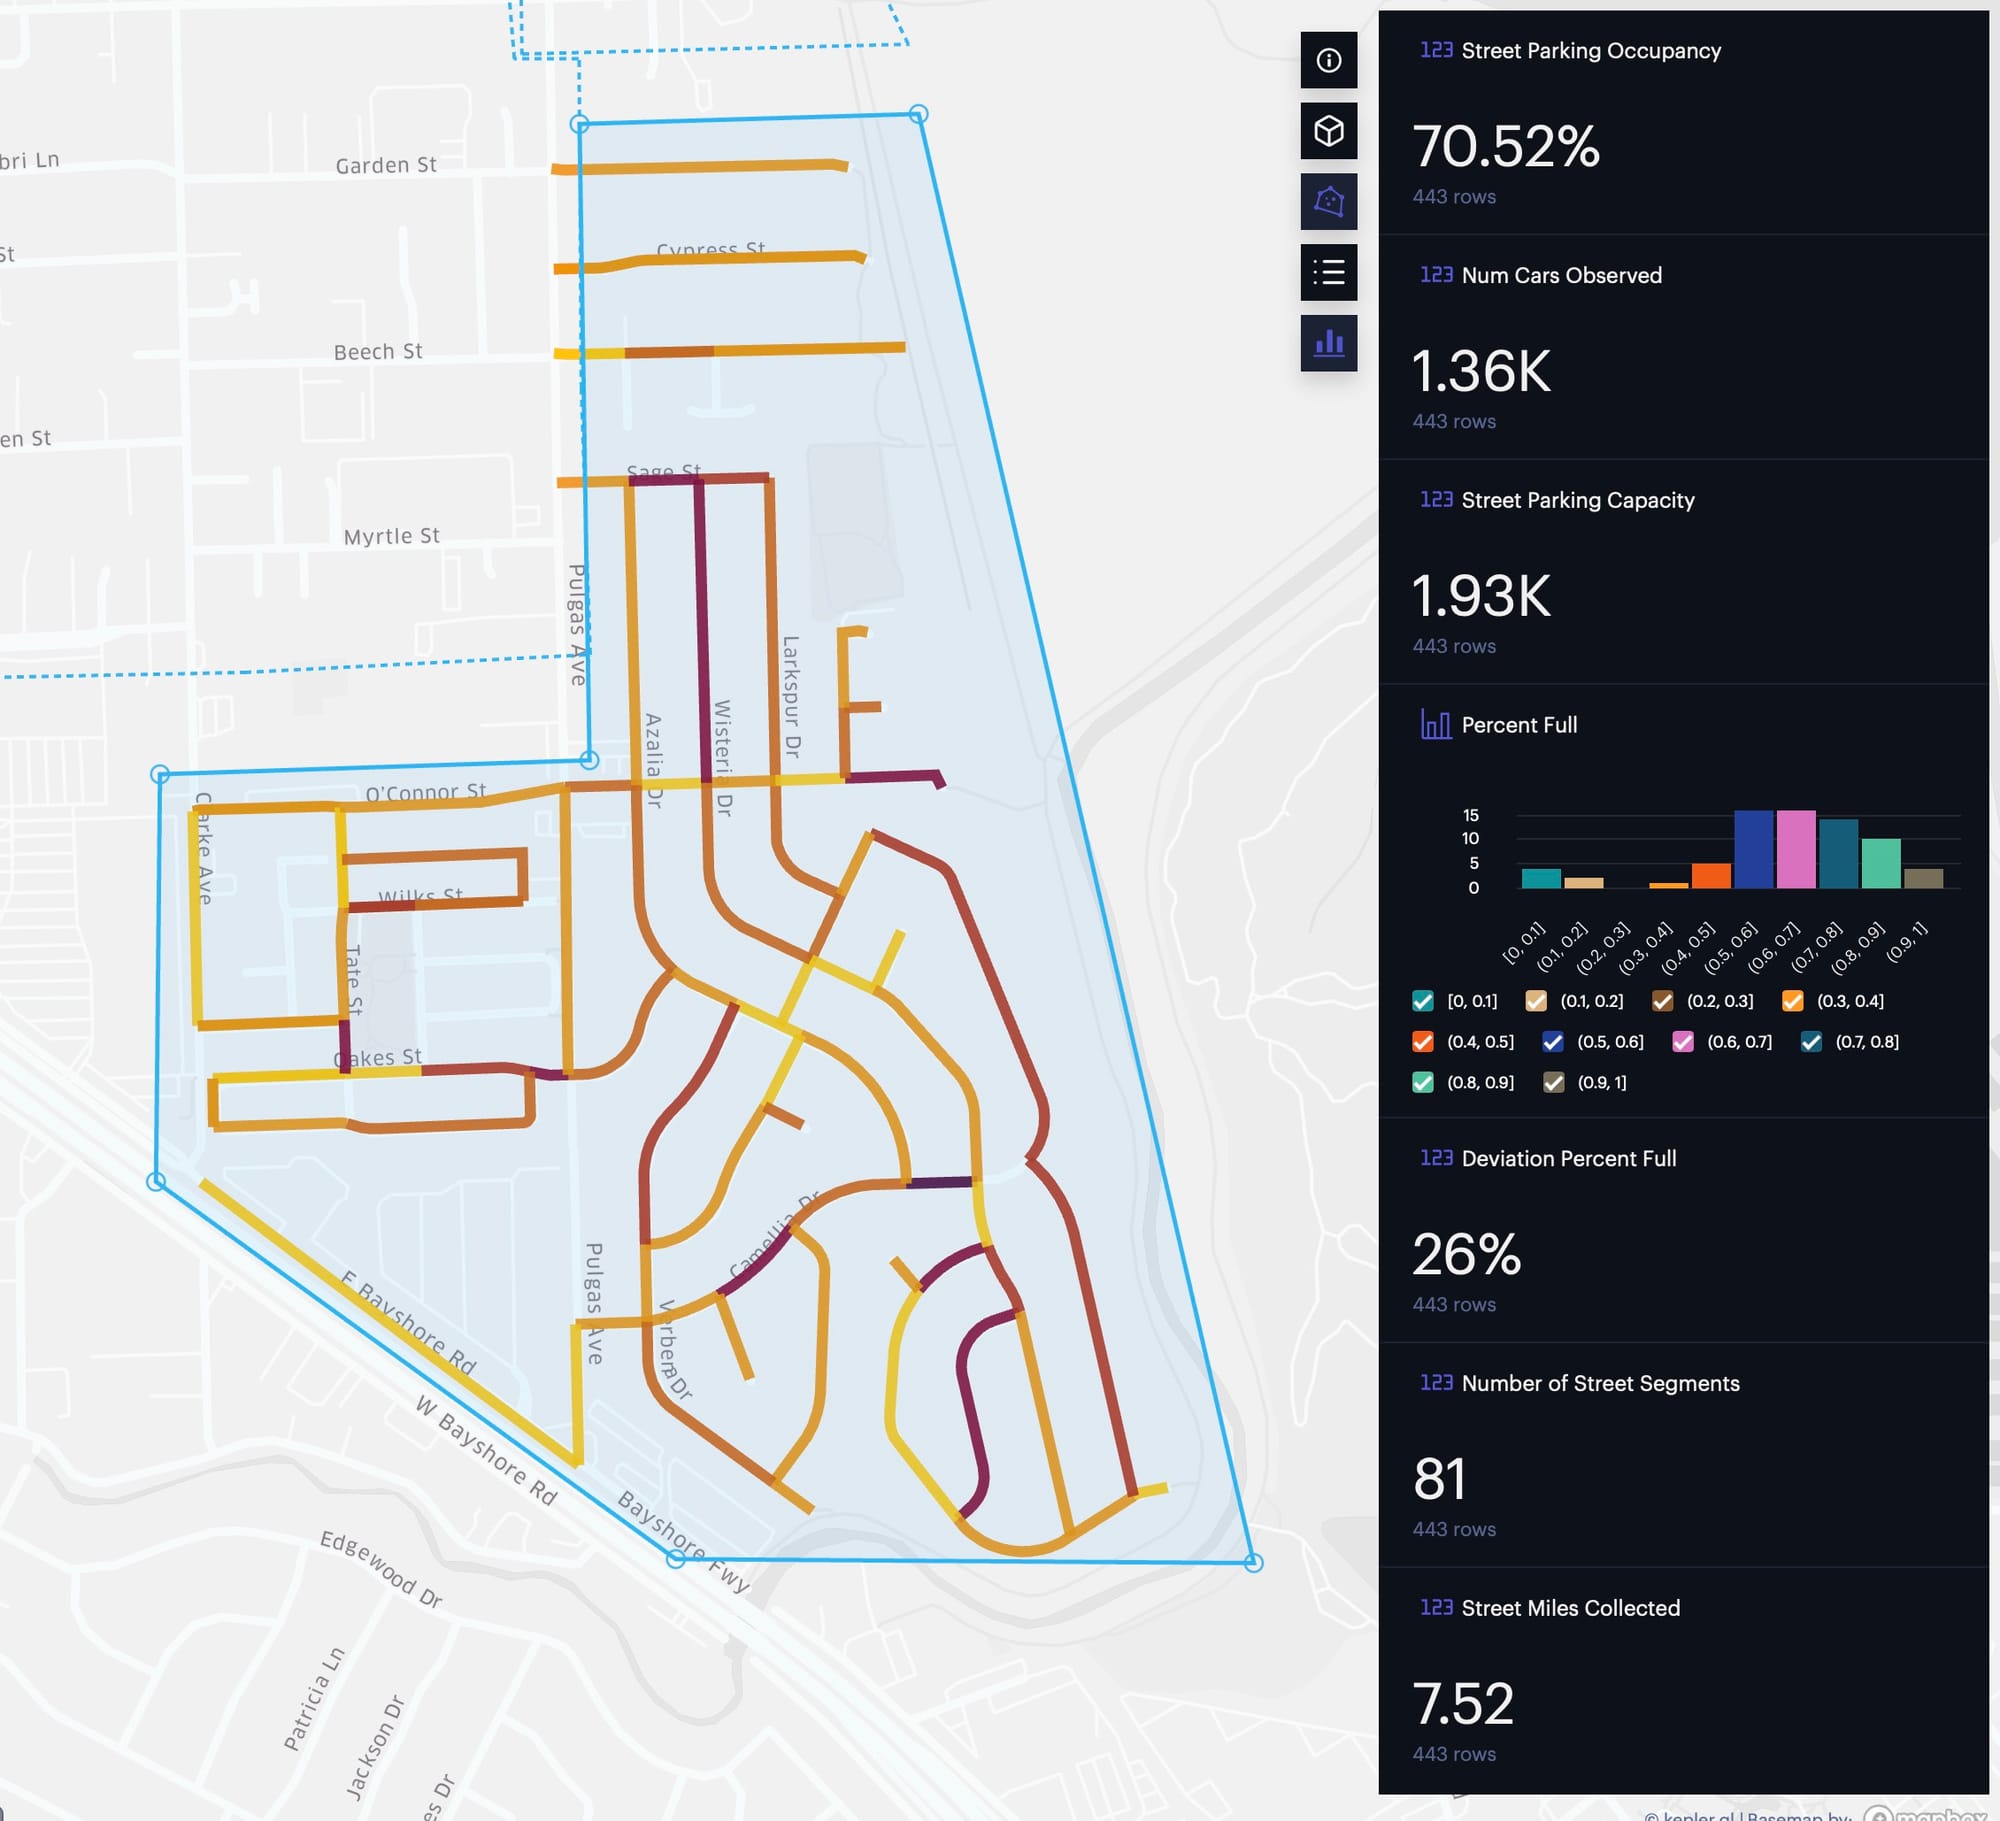
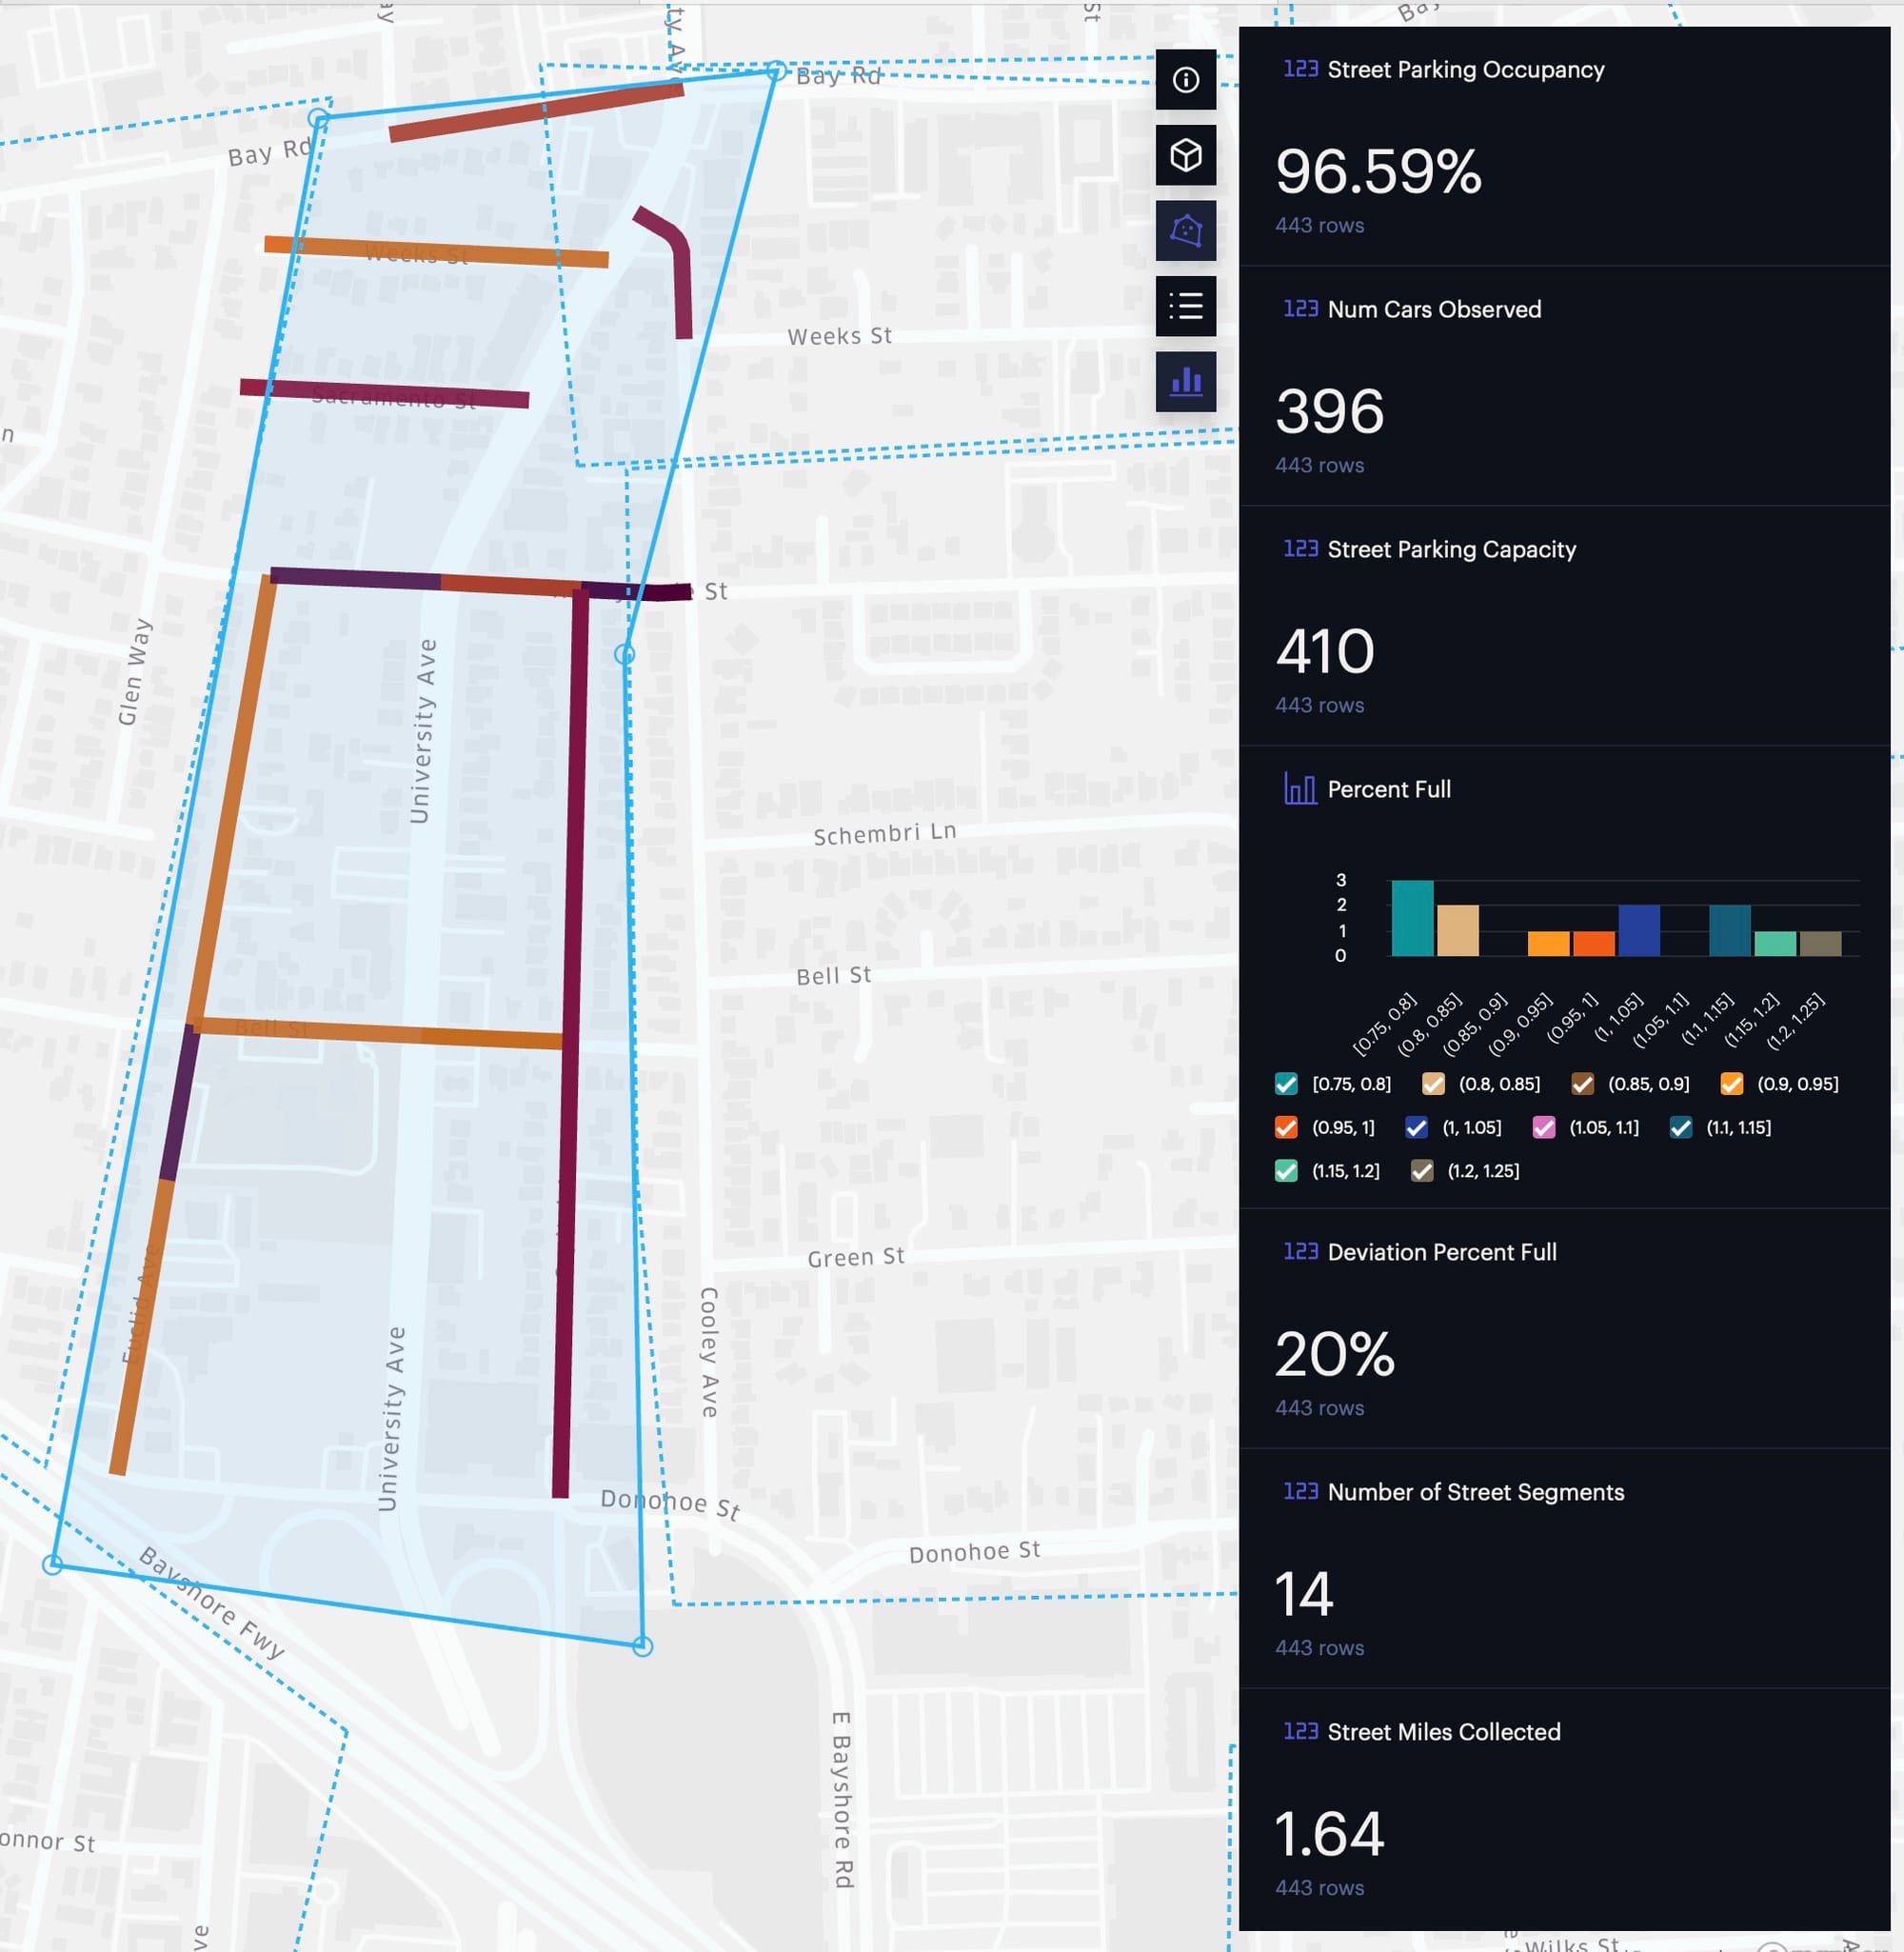
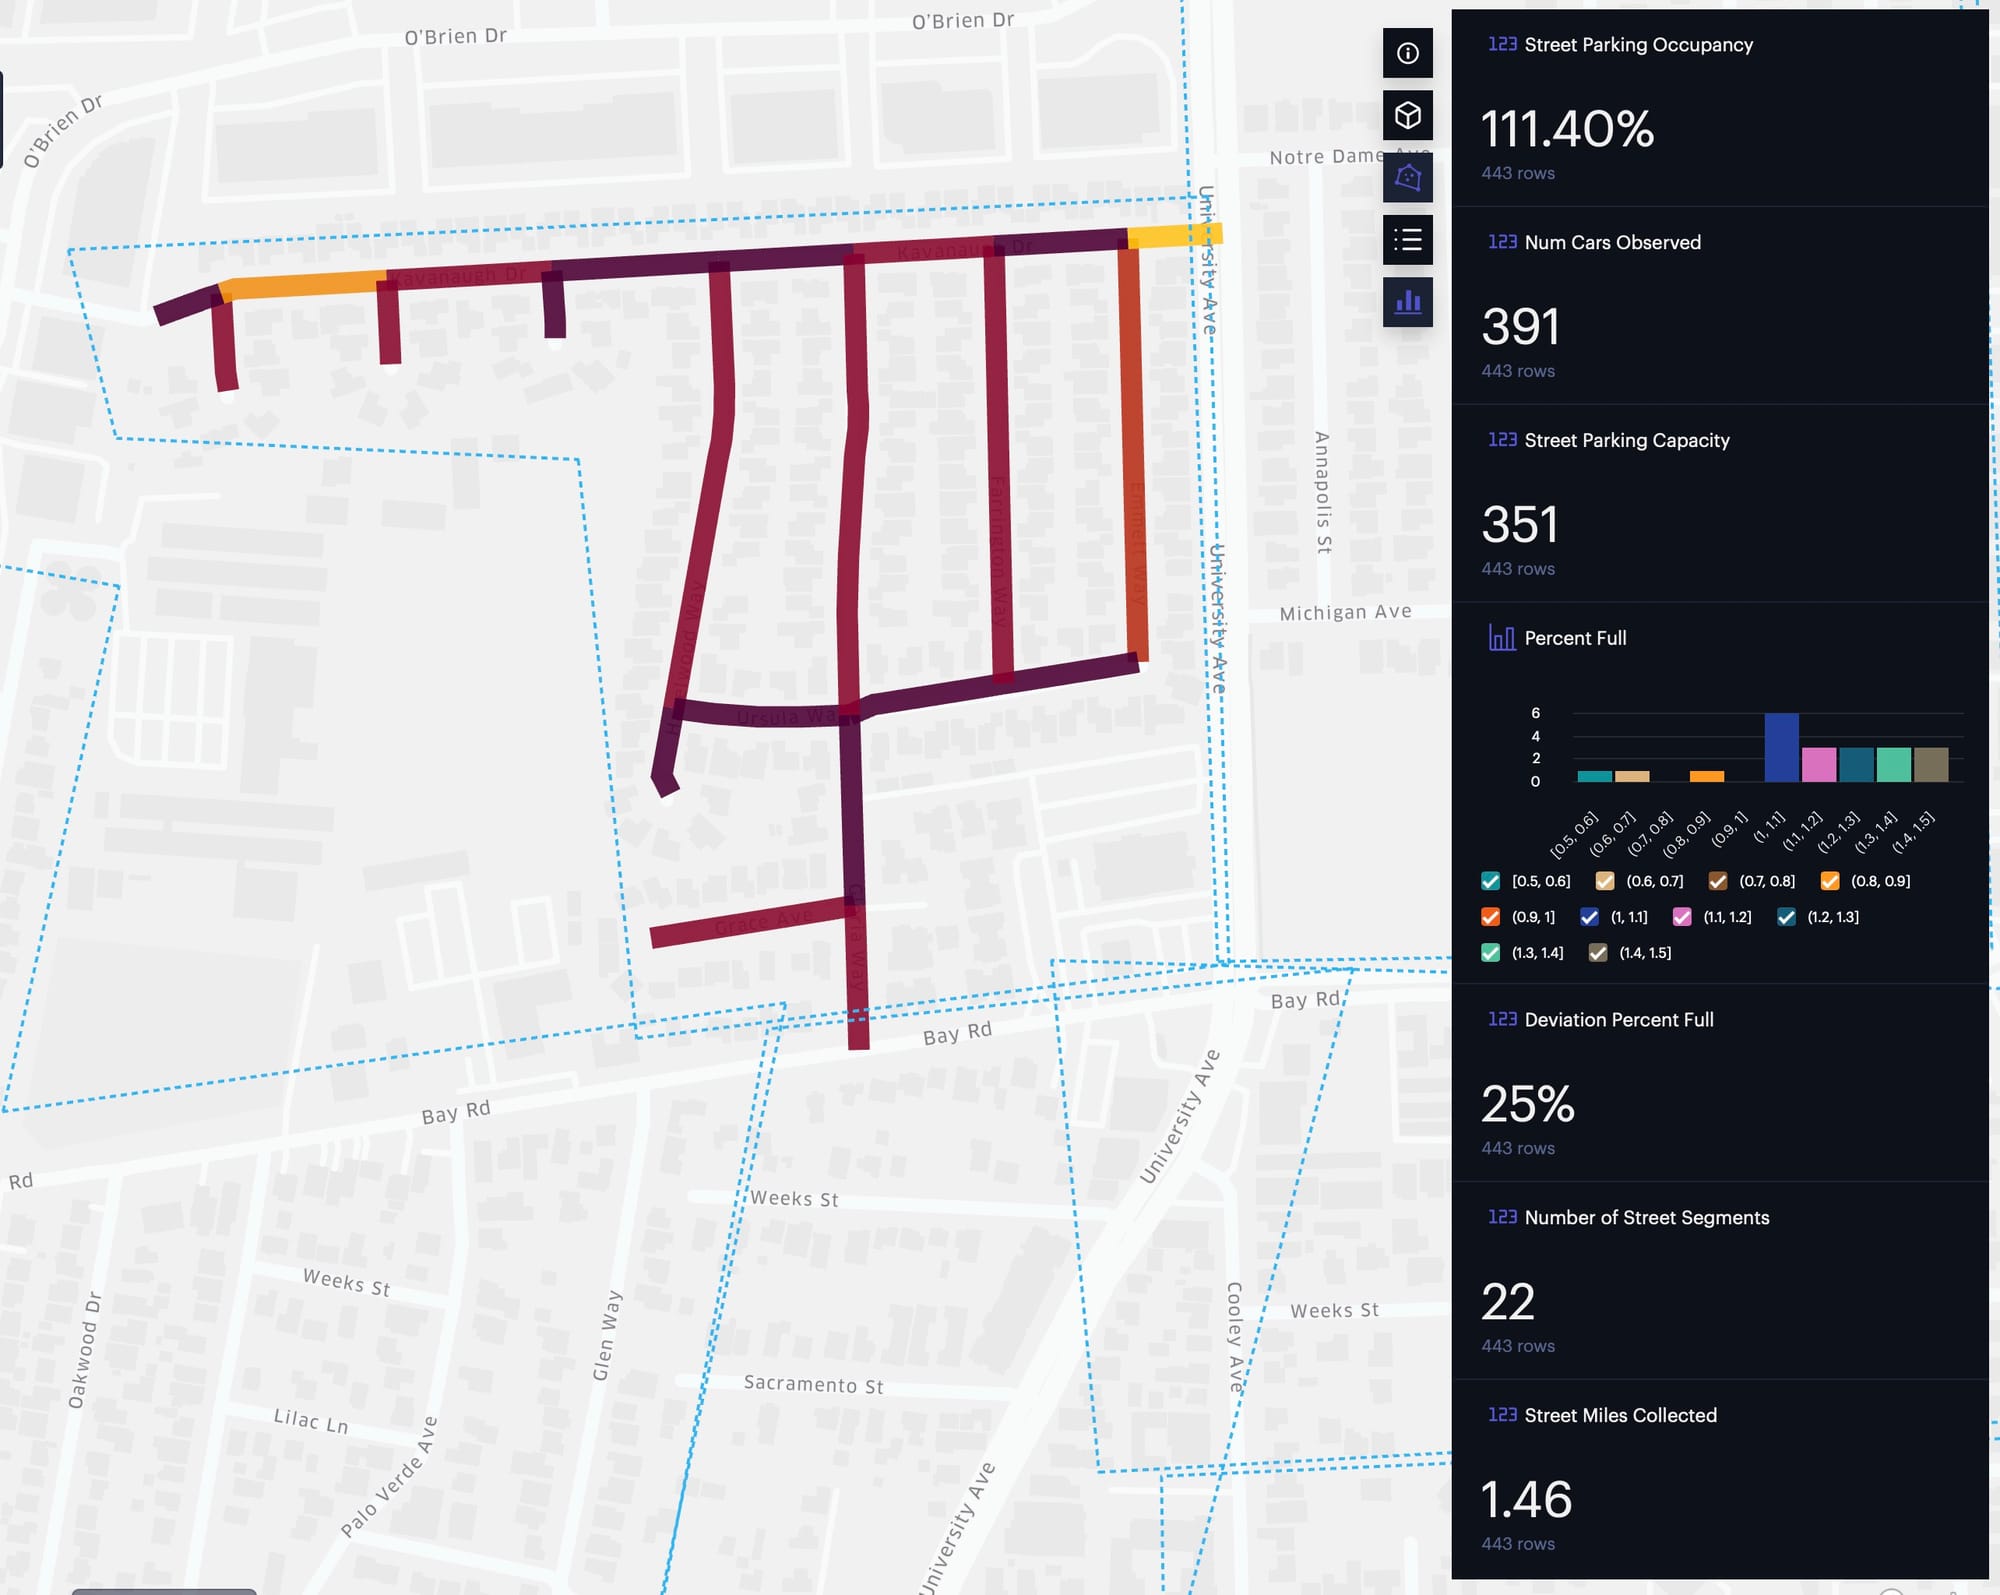
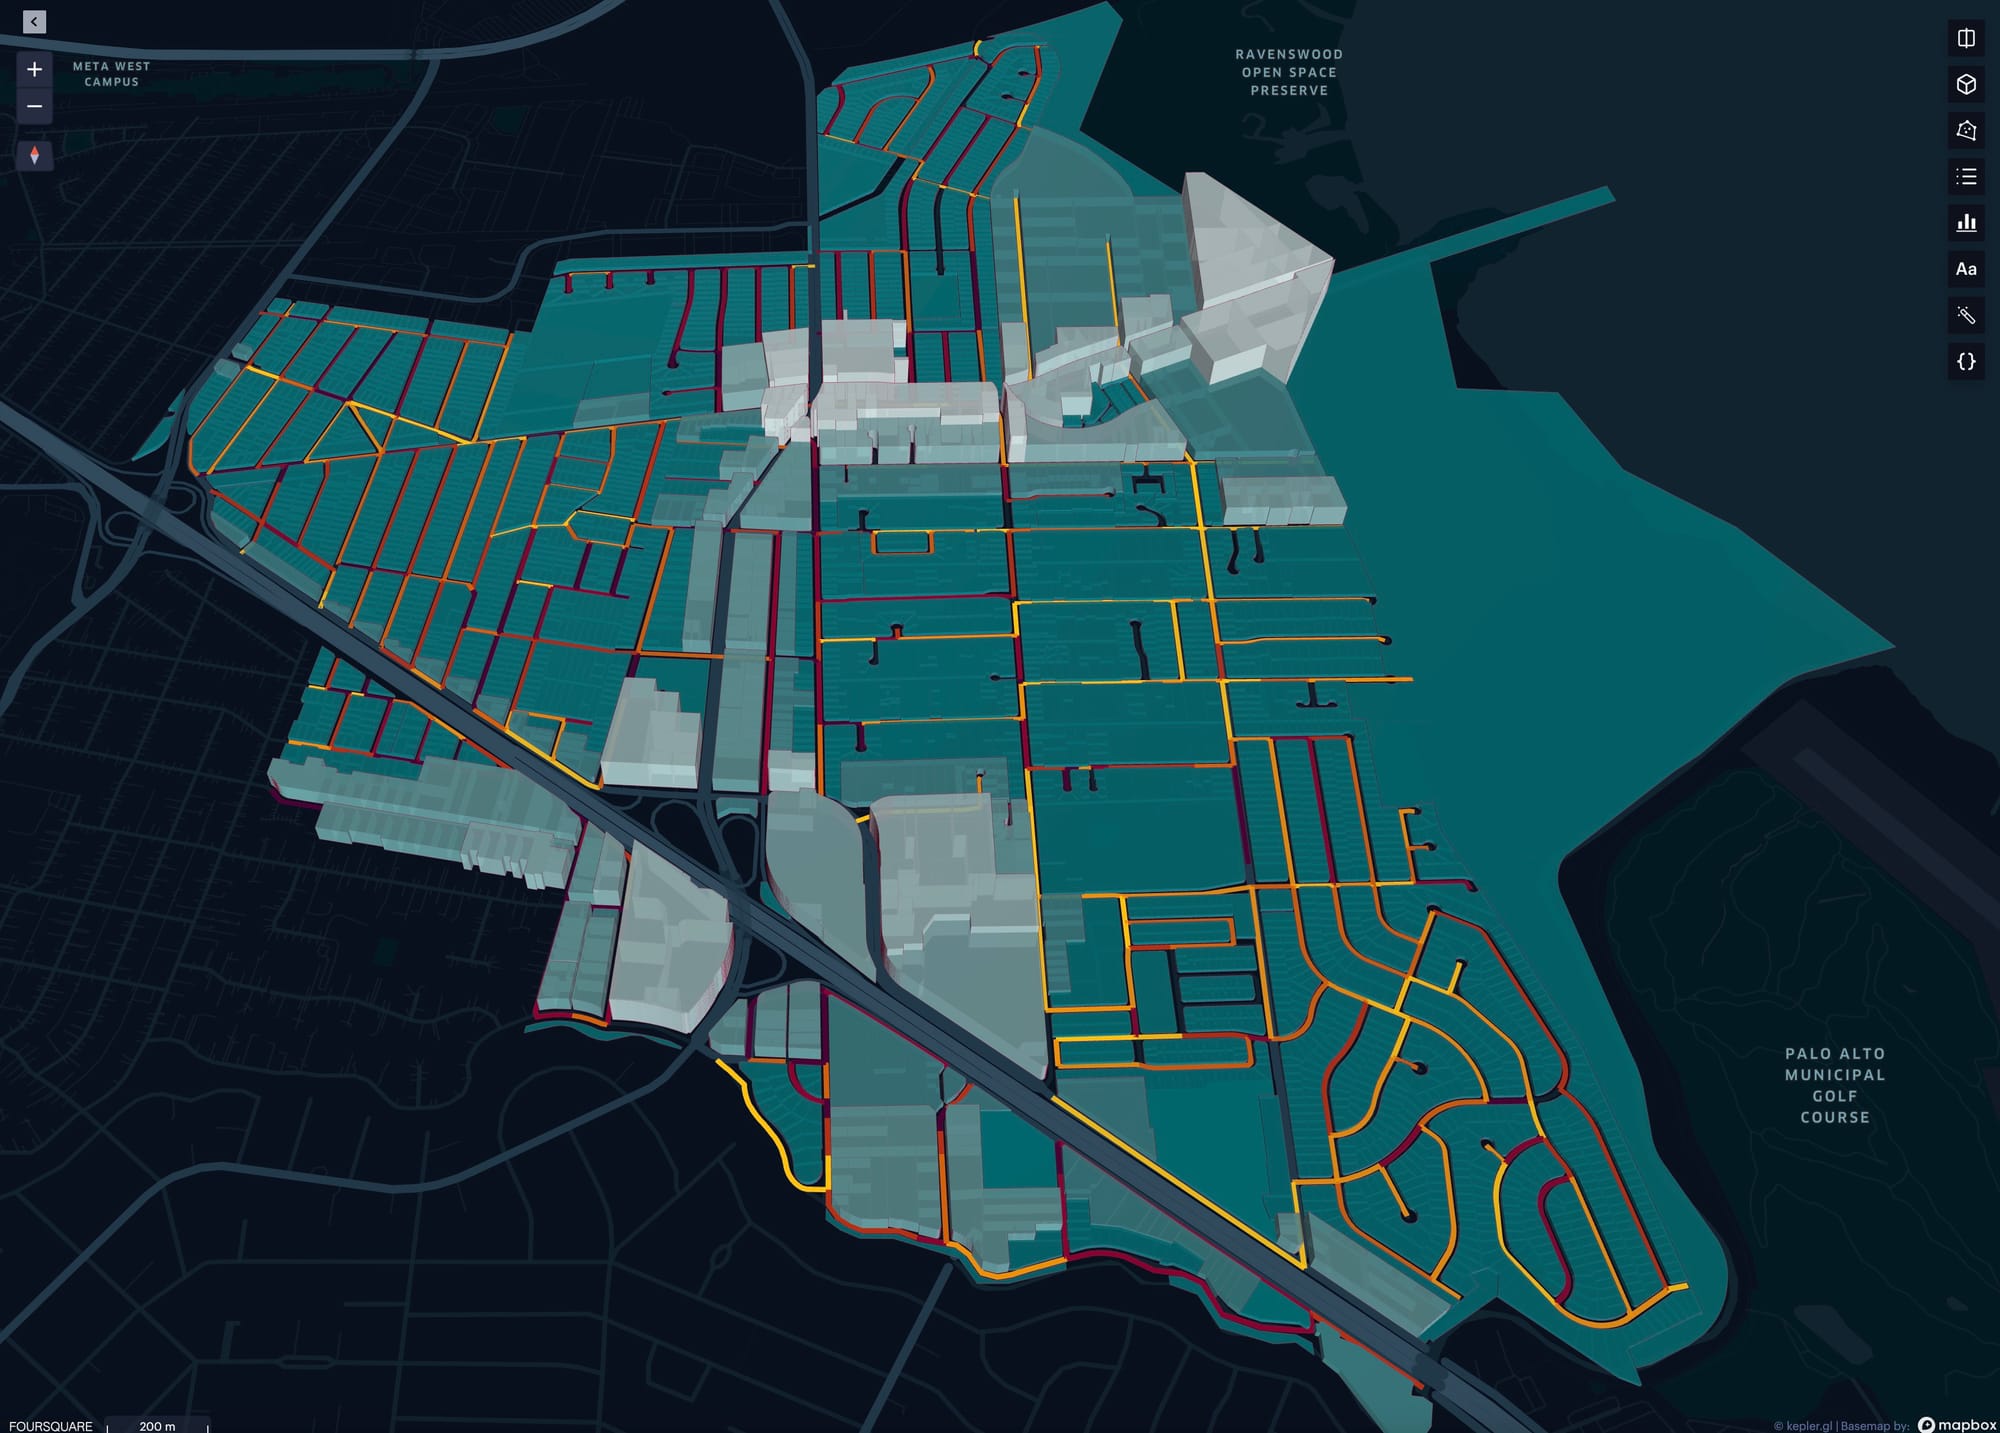
Street parking occupancy percentage data can be viewed per street segment in this map visualization dashboard (Fig 1): https://studio.foursquare.com/map/public/967a082e-253b-43b6-bf8a-de98a5413ff1. We encourage you to play around with it! Don't worry about breaking anything; any changes you make will not change the source dashboard.
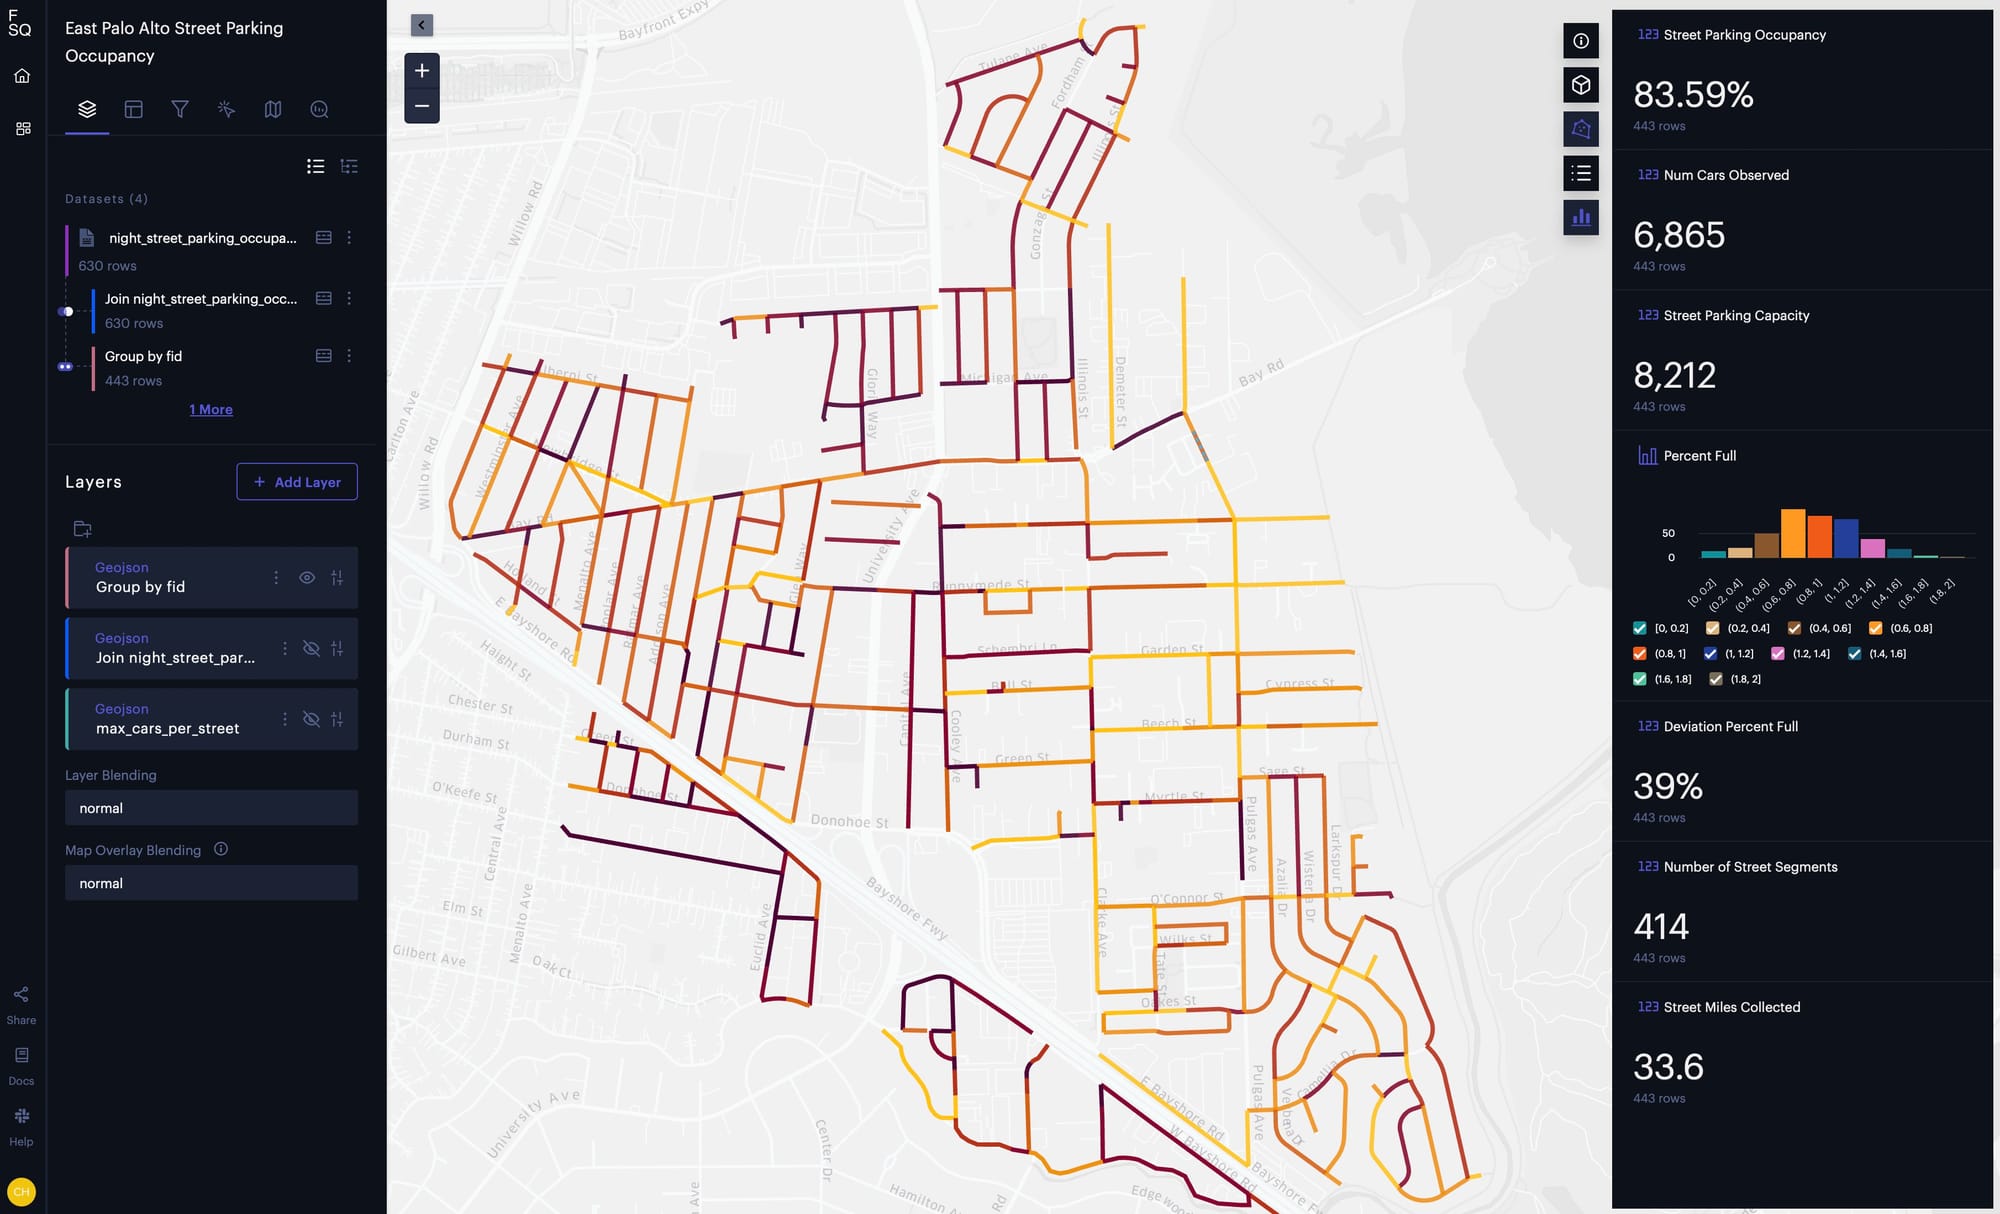
Fig 1. This Foursquare Studio map dashboard displays the percent occupancy (percent full), number of cars observed, and parking capacity of each street segment in East Palo Alto.
Introduction
Many East Palo Alto residents have complained about the parking problem over the past 8 years, as evidenced by numerous public comments at city meetings or on Facebook groups. In a 10/23/24 poll on the East Palo Alto Neighbors Facebook group, 80% of residents answered "No" to "Is it easy to find street parking in your neighborhood in East Palo Alto?" (see screenshot in Mark Dinan's post).
There has been little measurable progress in addressing East Palo Alto’s parking challenges since 2017. During my time on the Public Works and Transportation Commission, beginning in 2023, I spoke with city staff and our transportation consultant, Hexagon, as we explored a Residential Parking Permit (RPP) program. It became clear that we were trying to solve a problem without sufficient data: no one had a comprehensive picture of how fully parked our public streets really are. The most recent available data comes from the 2020 Mobility Study (based on data collected in 2018), which only covers parking occupancy in the Gardens neighborhood, parts of Weeks, and portions of Palo Alto Park — and only during the hours of 12 a.m. to 4 a.m. Given this gap, several transportation professionals and community members familiar with my drone work encouraged me to collect updated data to answer a fundamental question: What is the parking occupancy rate in each neighborhood in East Palo Alto?
Statistics by Neighborhood
As shown in Table 1, the highest parked neighborhoods are the West Side south of University, Kavanaugh, West Side north of University, University Corridor, and University Village.
| Neighborhood | Parking Occupancy | Num Cars Observed | Street Parking Capacity | Street Miles Collected |
|---|---|---|---|---|
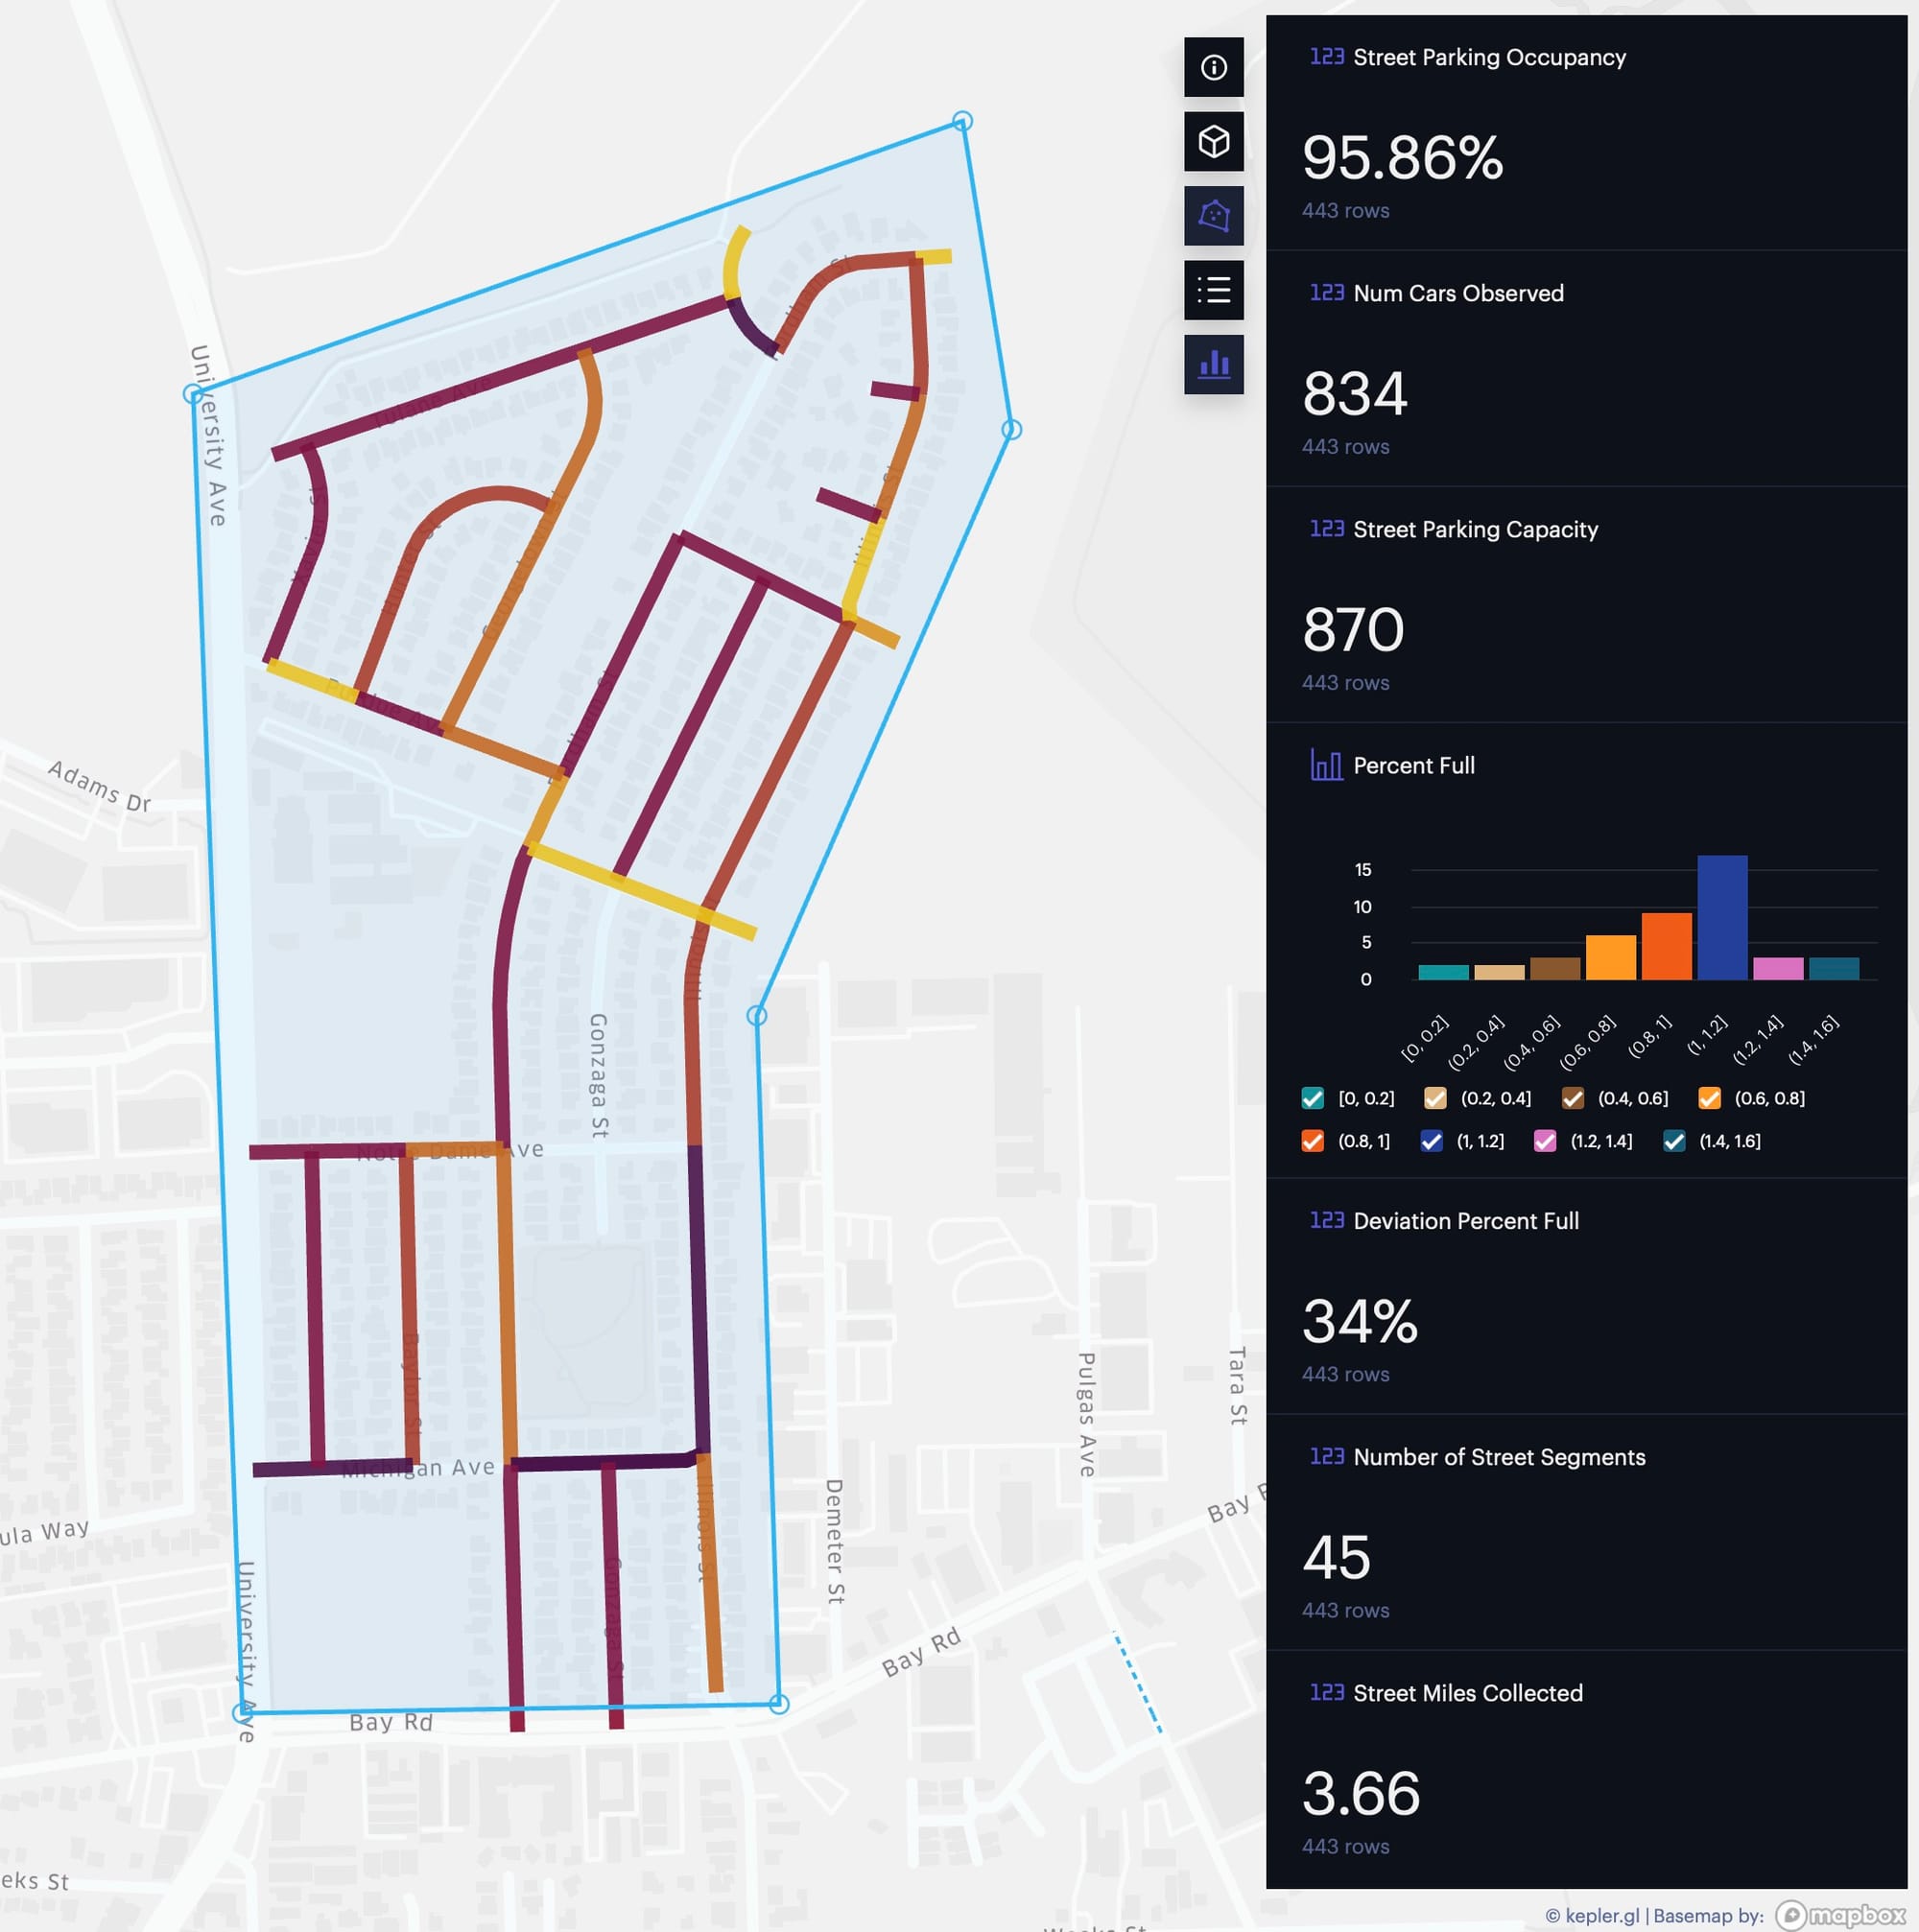
| University Village | 95.86% | 834 | 870 | 3.66 |
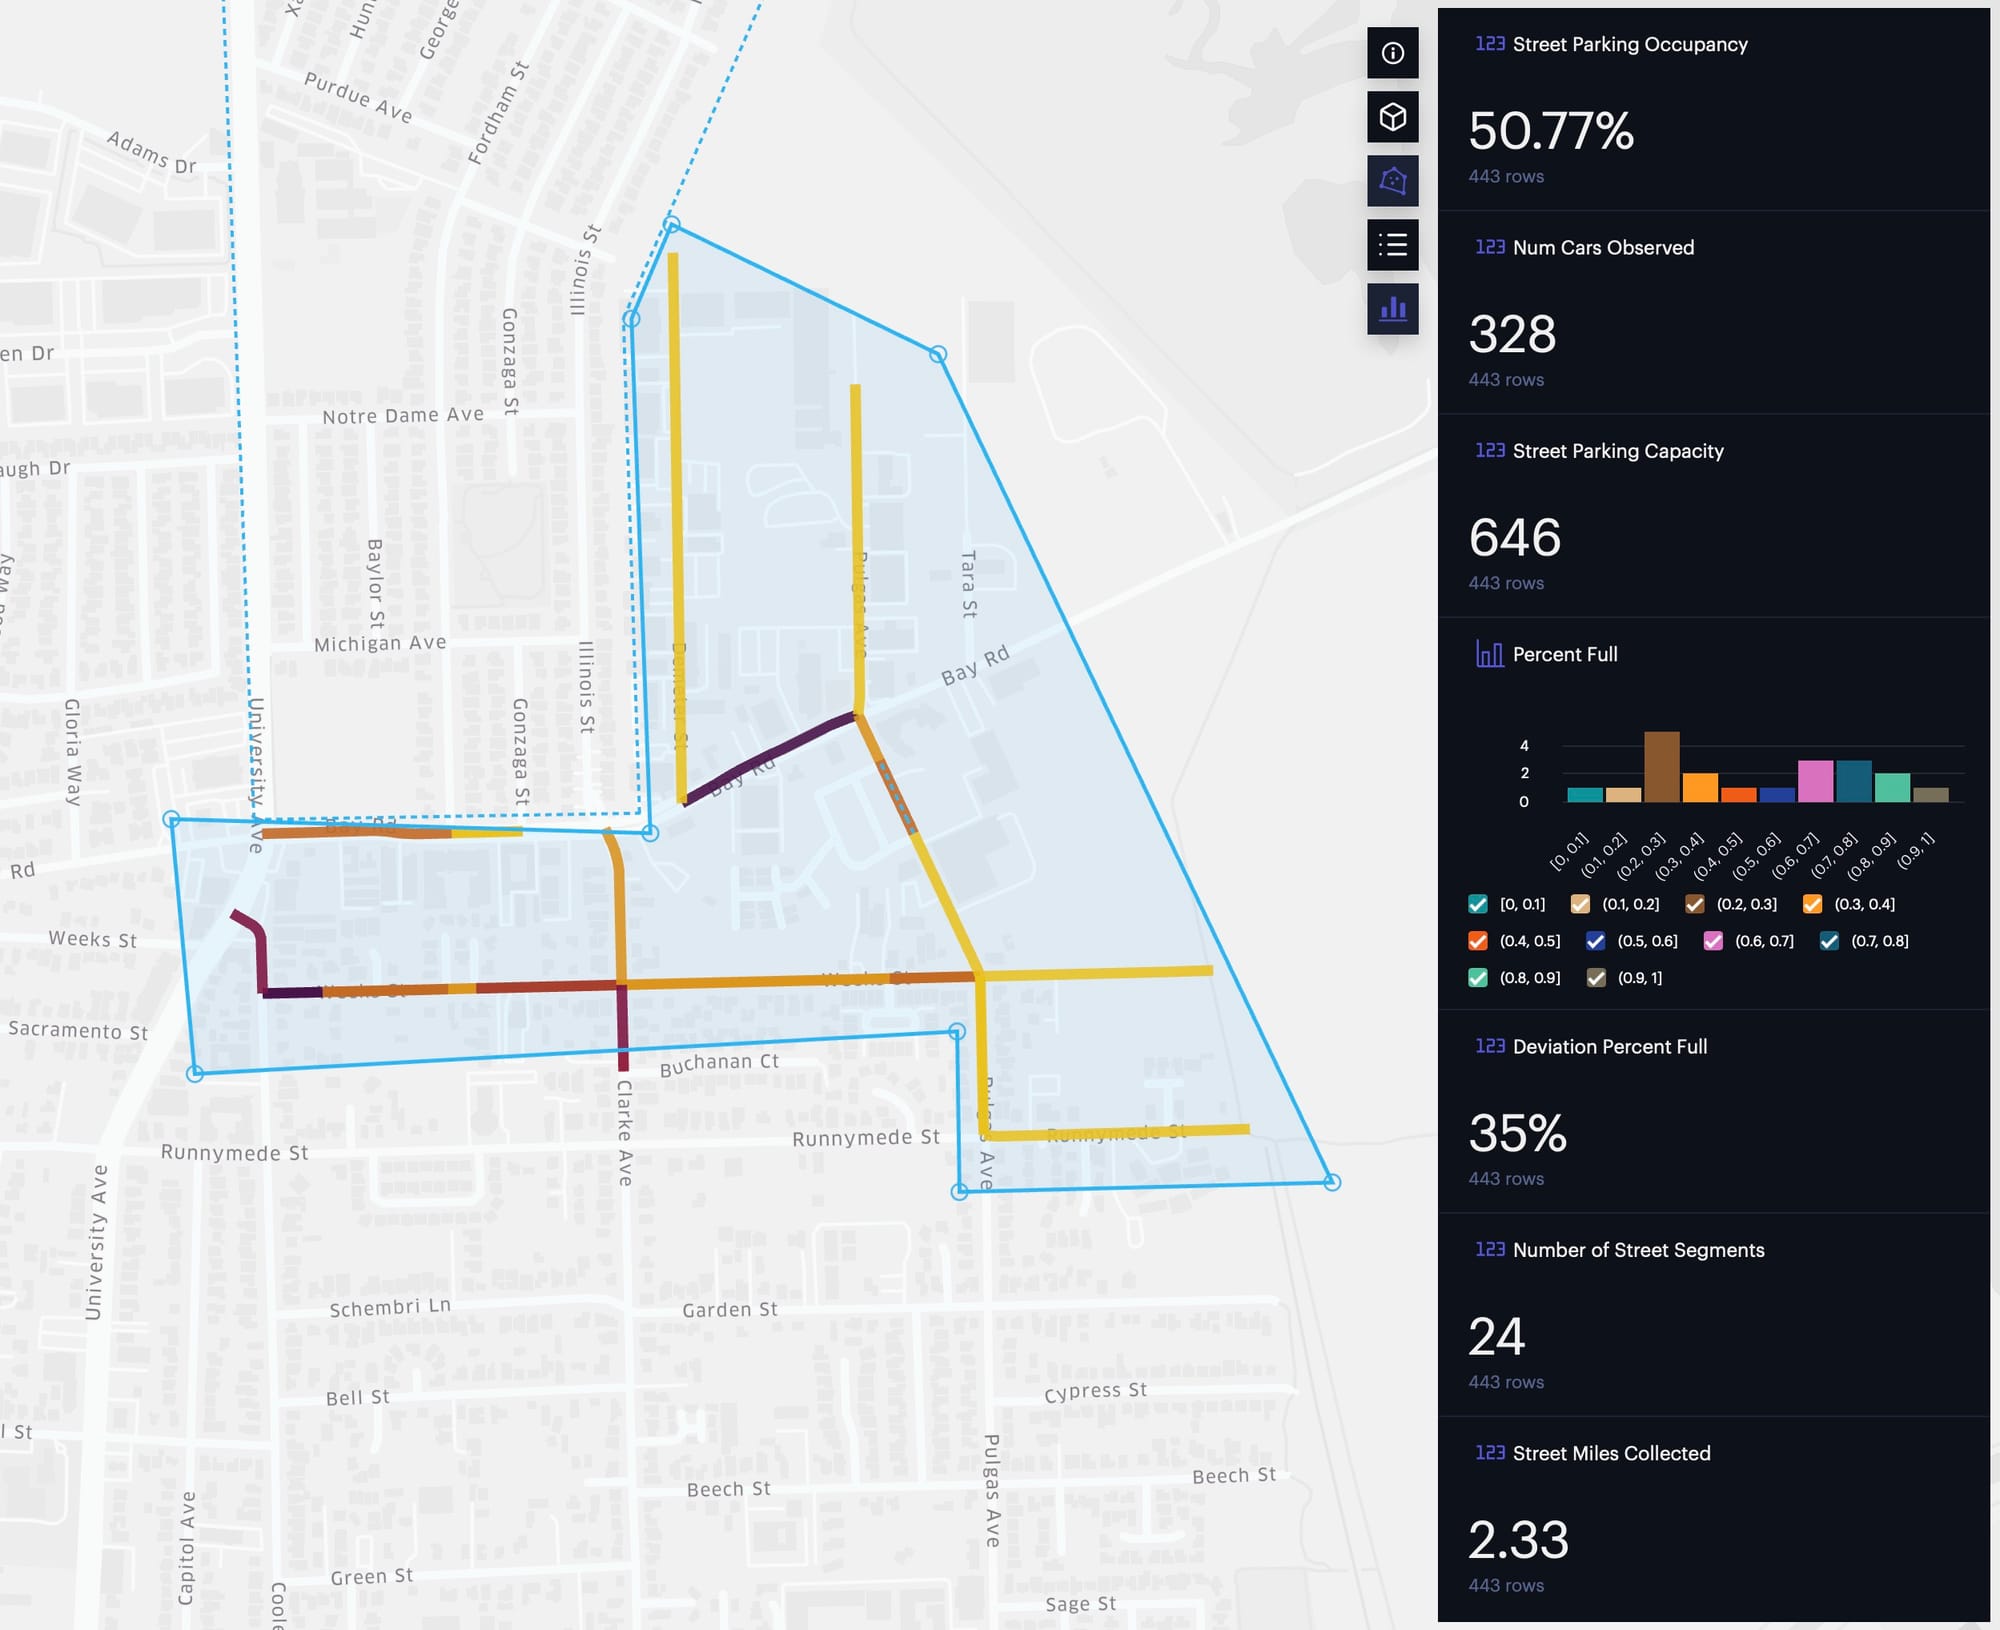
| Ravenswood Business District | 50.77% | 328 | 646 | 2.33 |
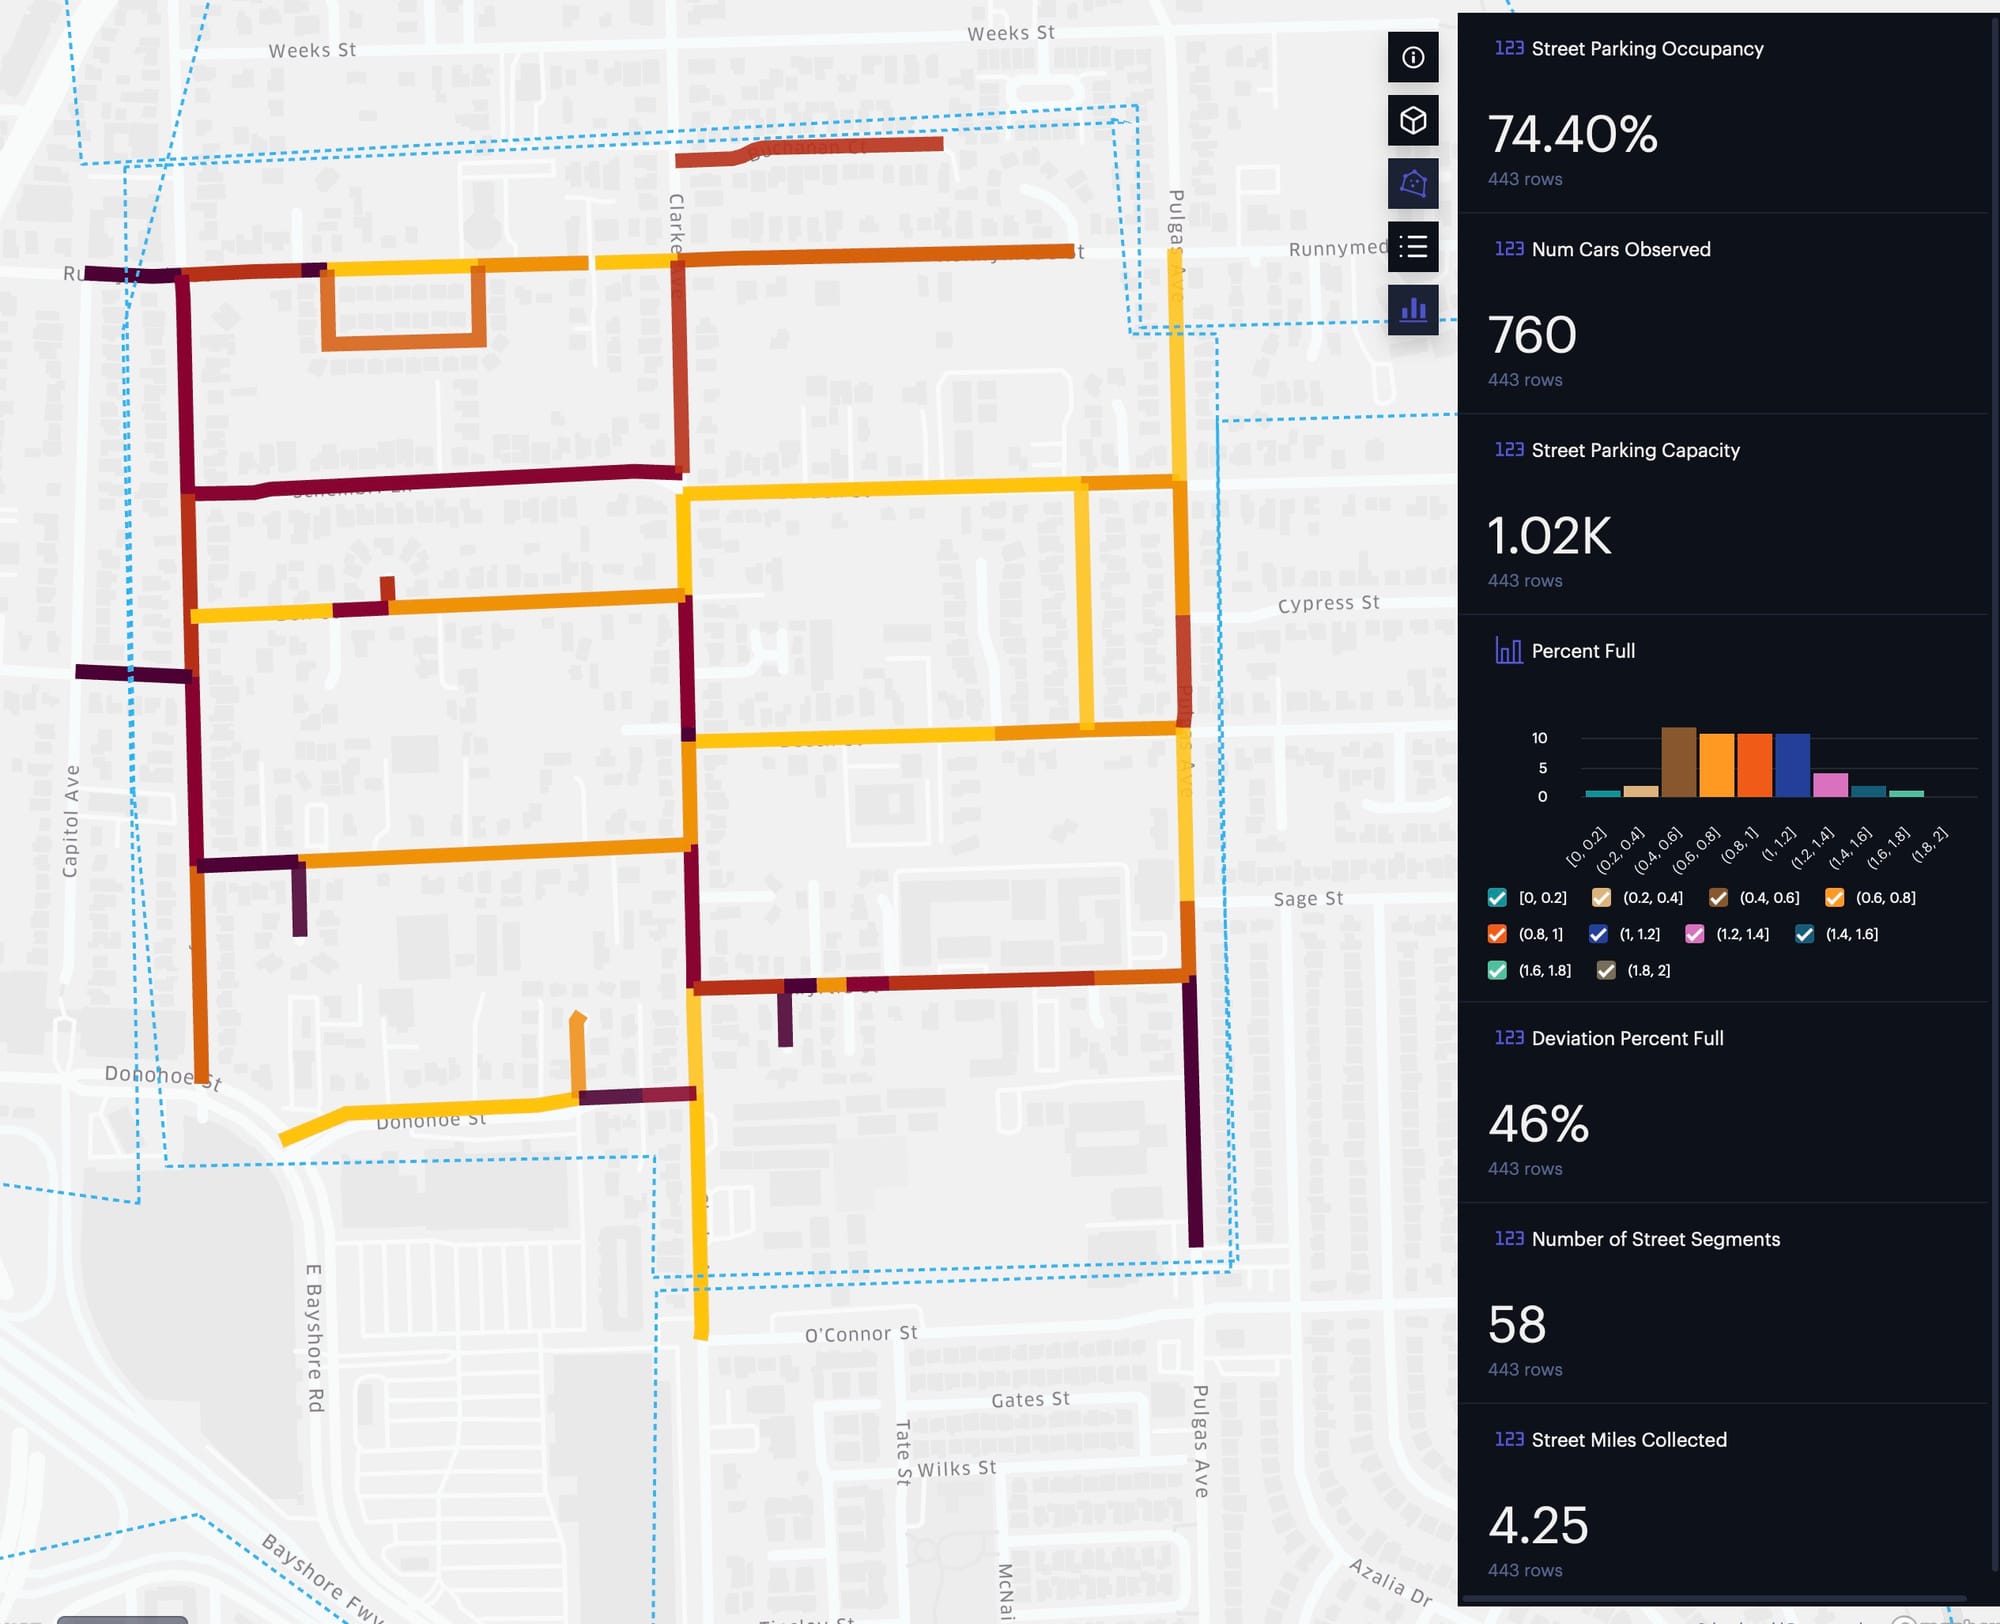
| Weeks Neighborhood | 74.40% | 760 | 1020 | 4.25 |
| Gardens | 70.52% | 1360 | 1930 | 7.52 |
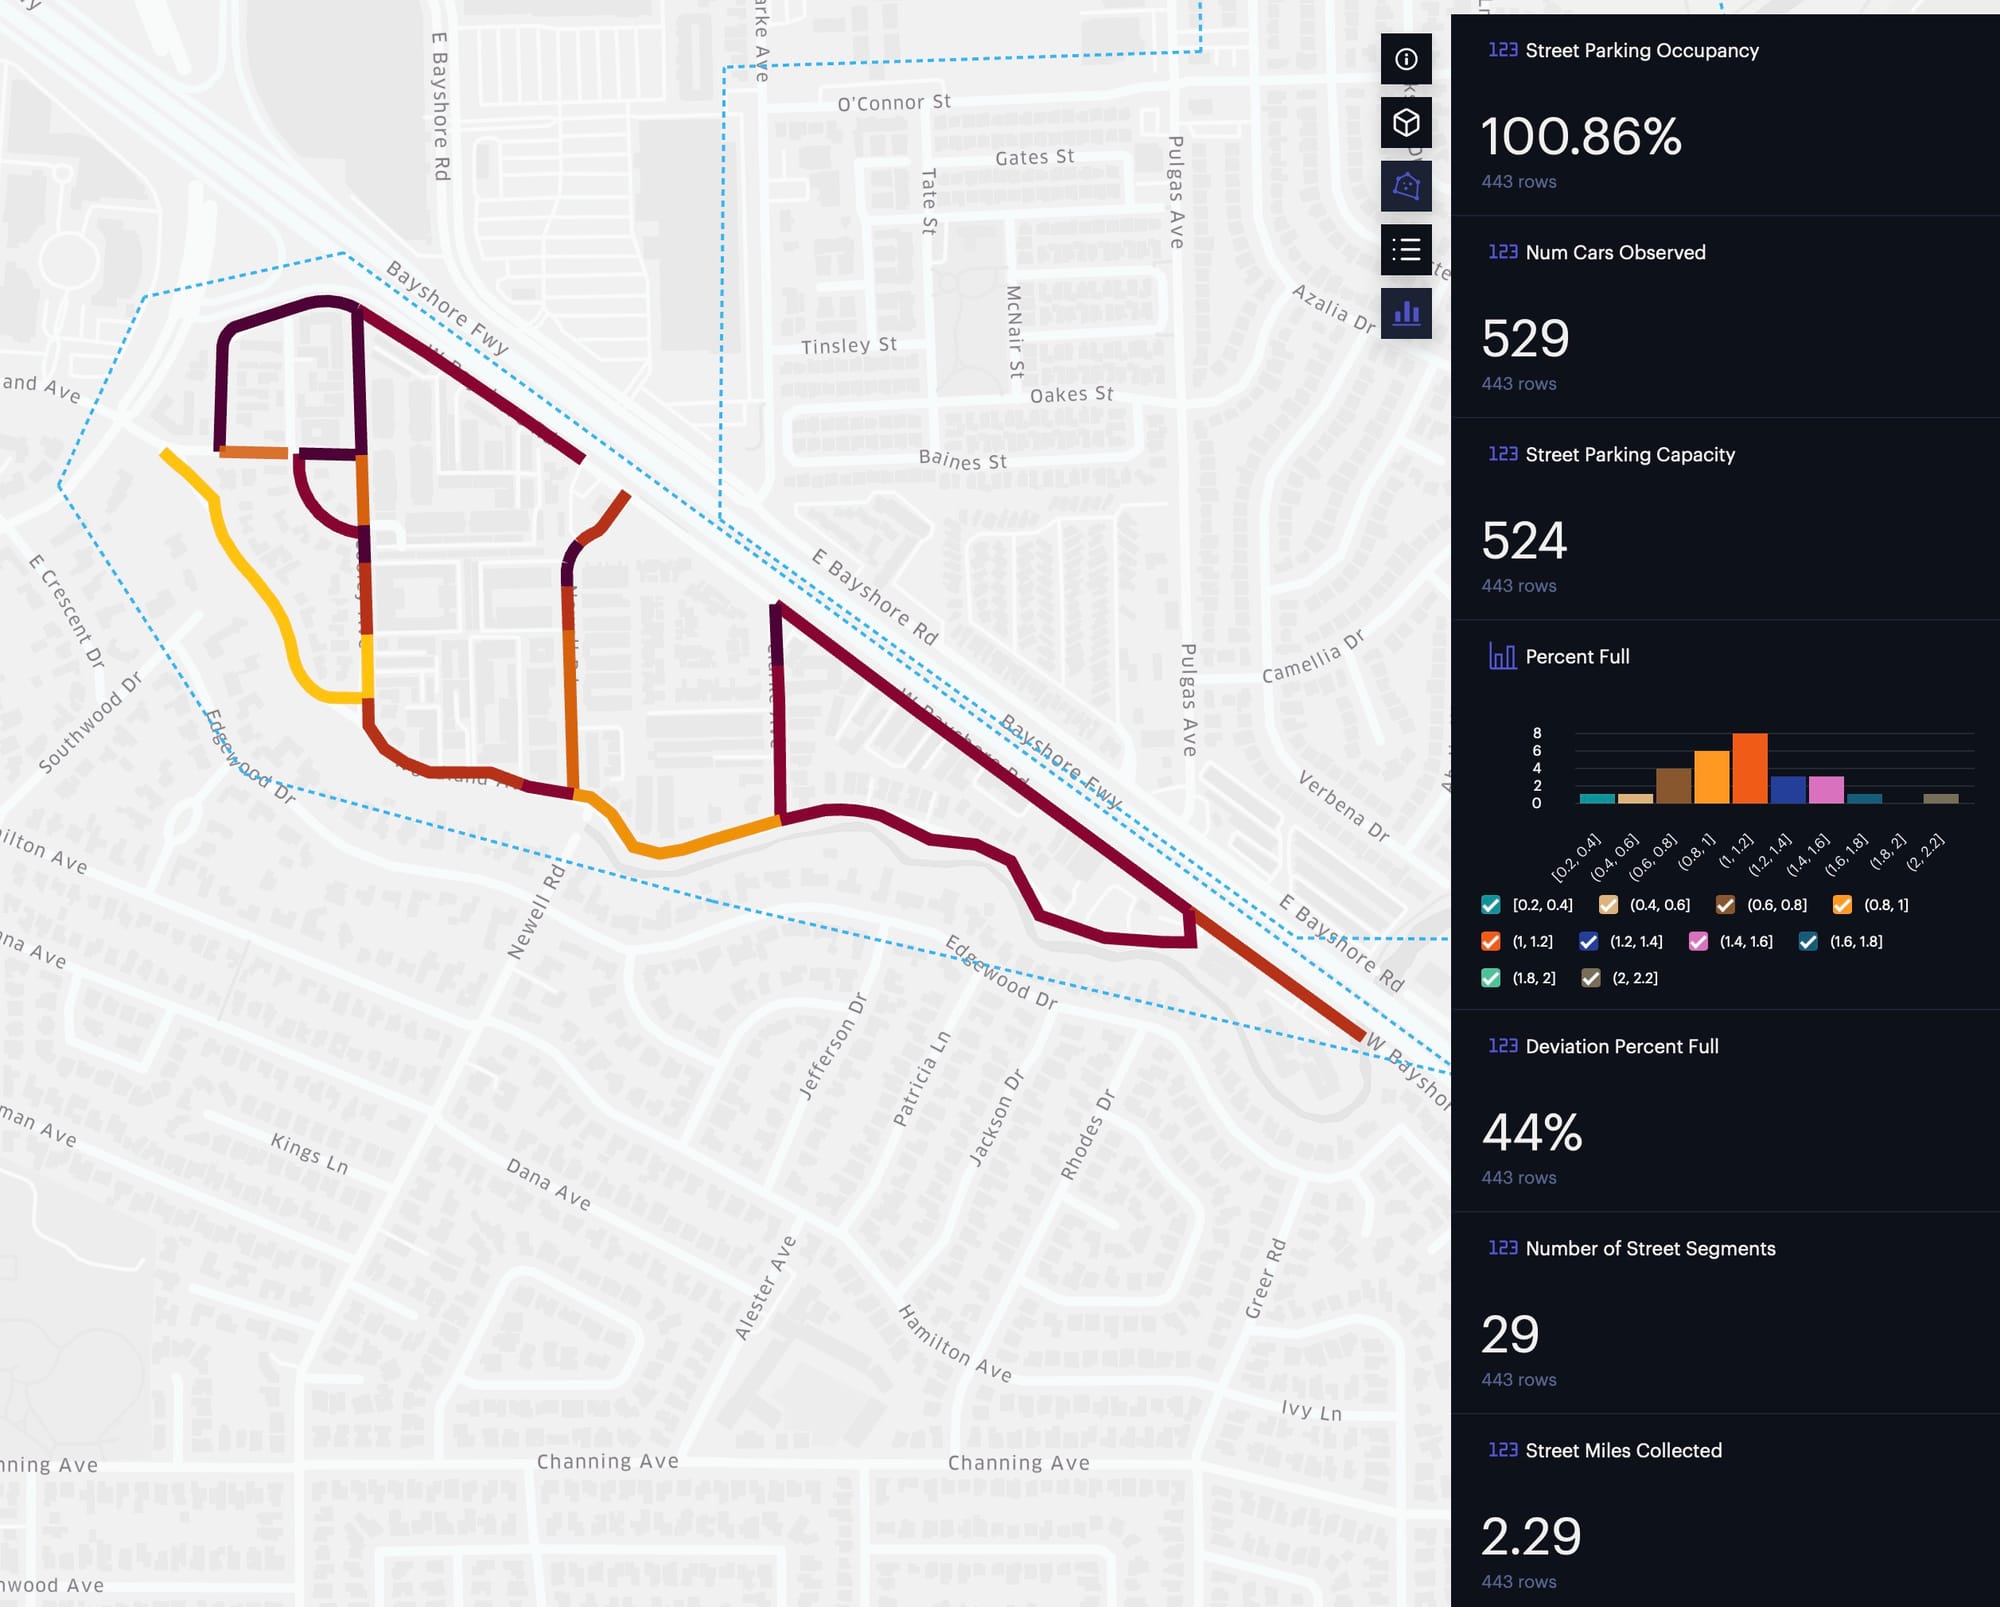
| West Side north of University | 100.86% | 529 | 524 | 2.29 |
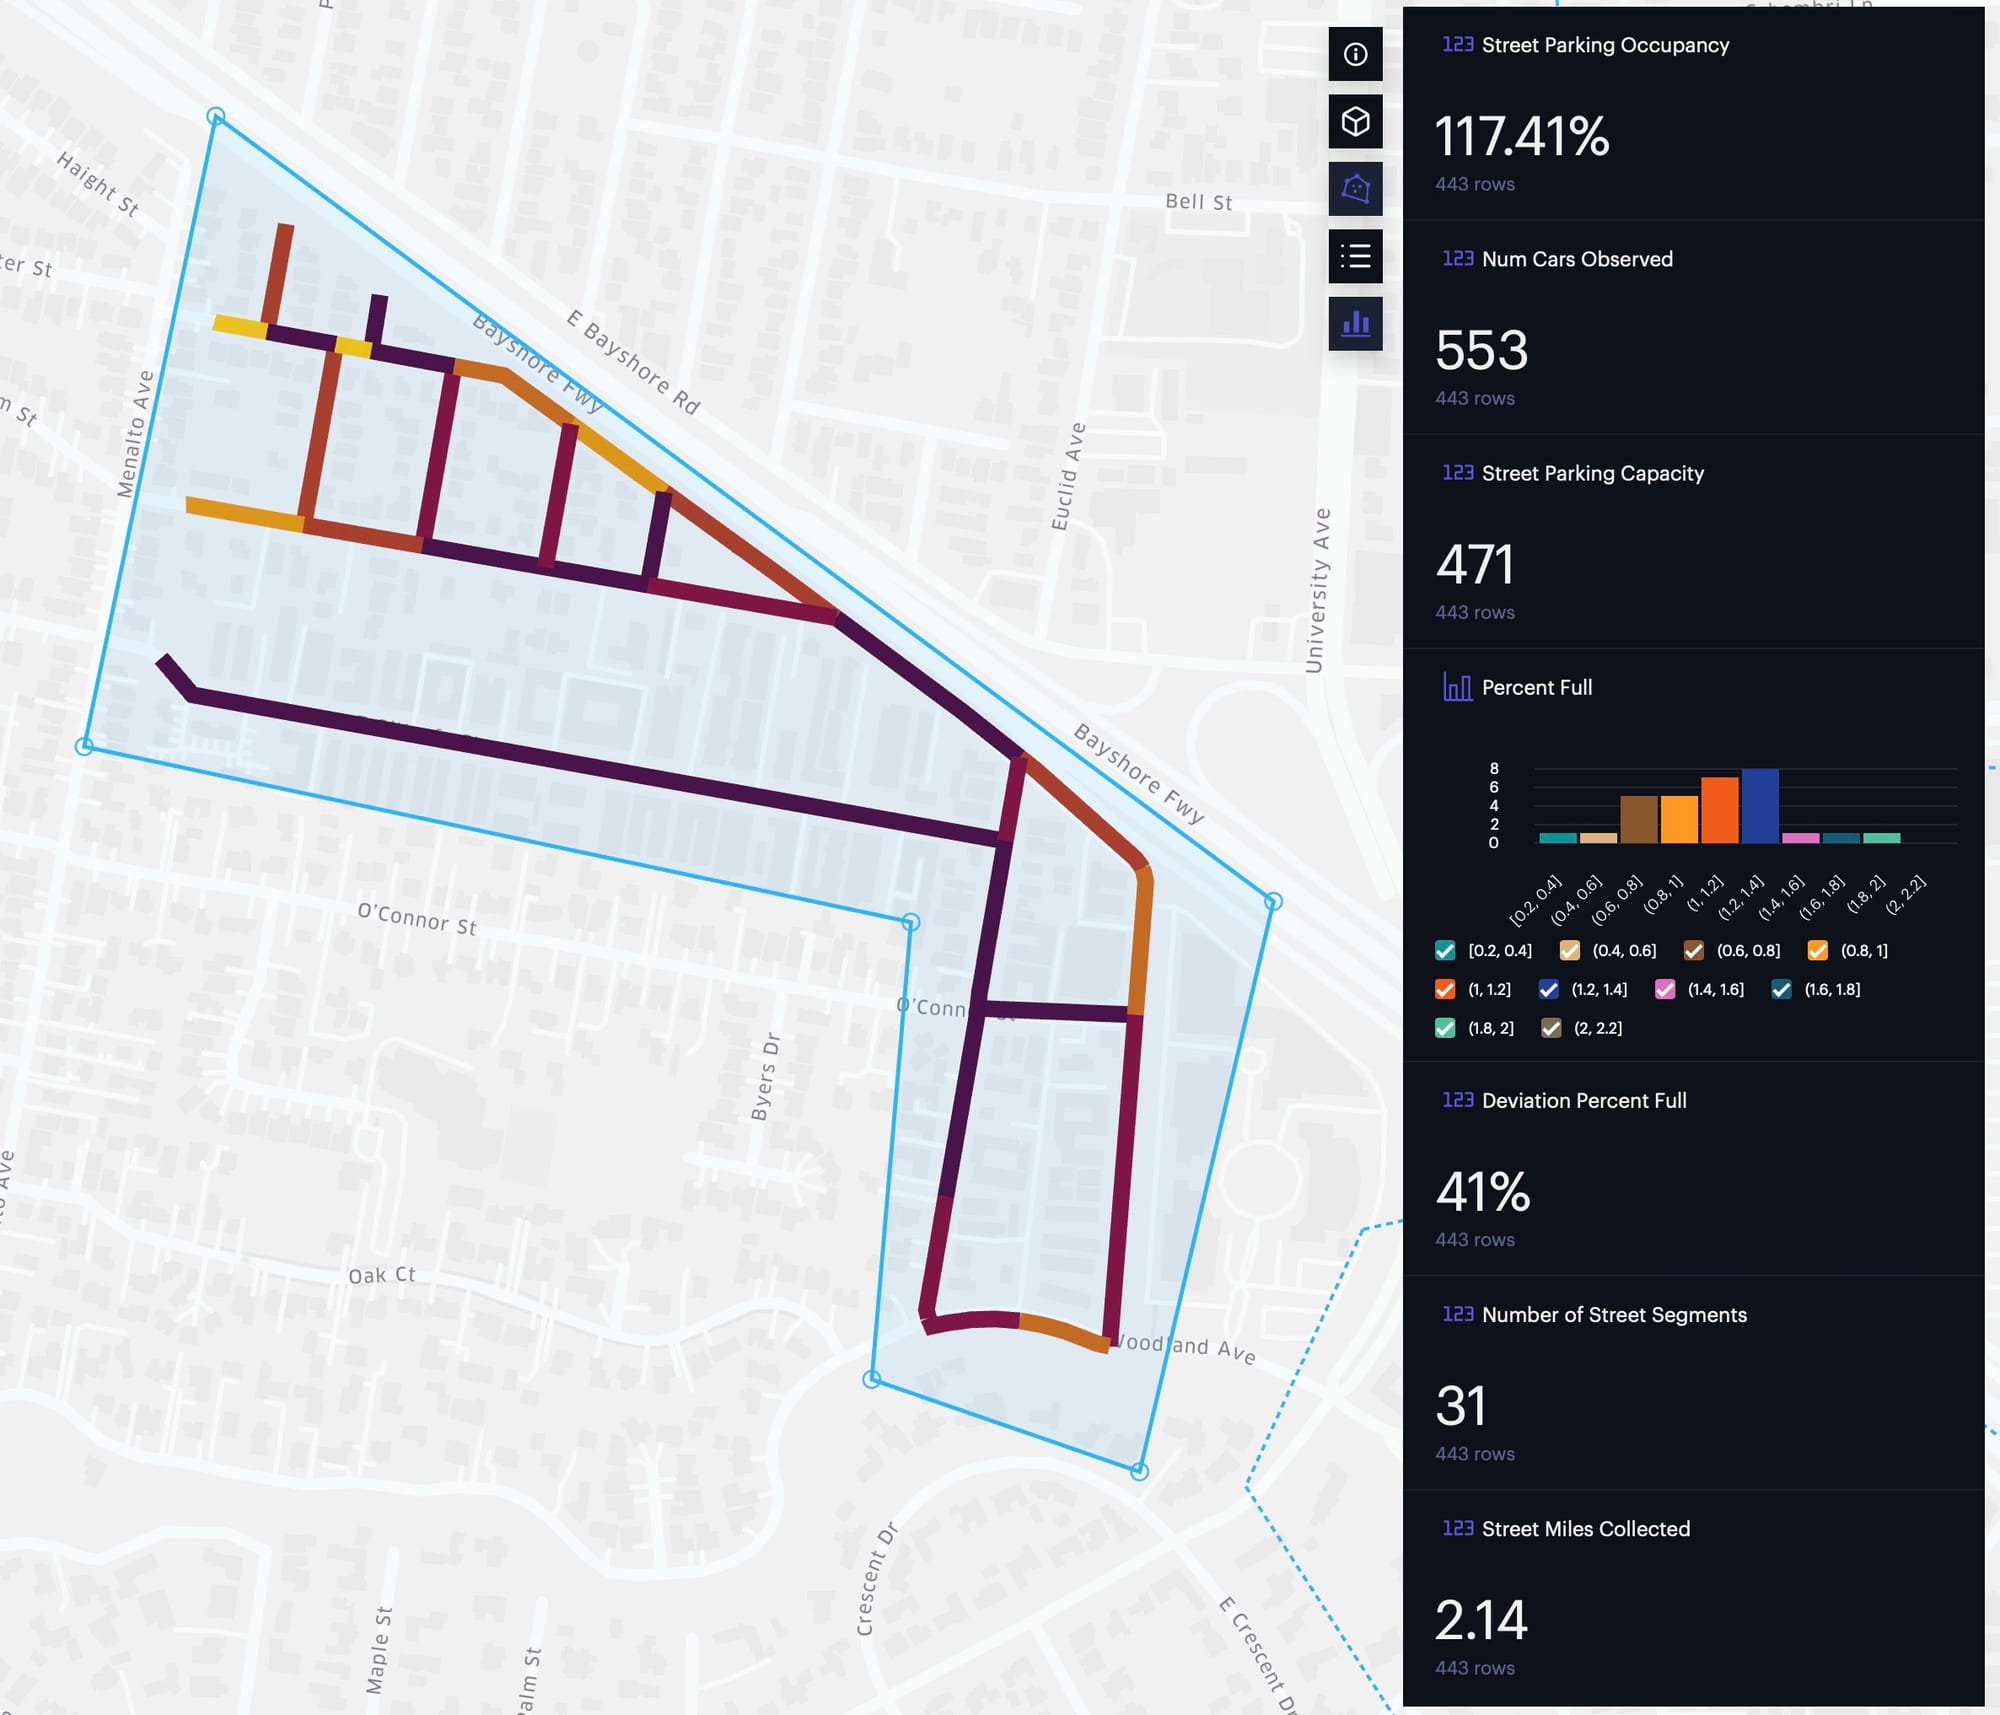
| West Side south of University | 117.41% | 553 | 471 | 2.14 |
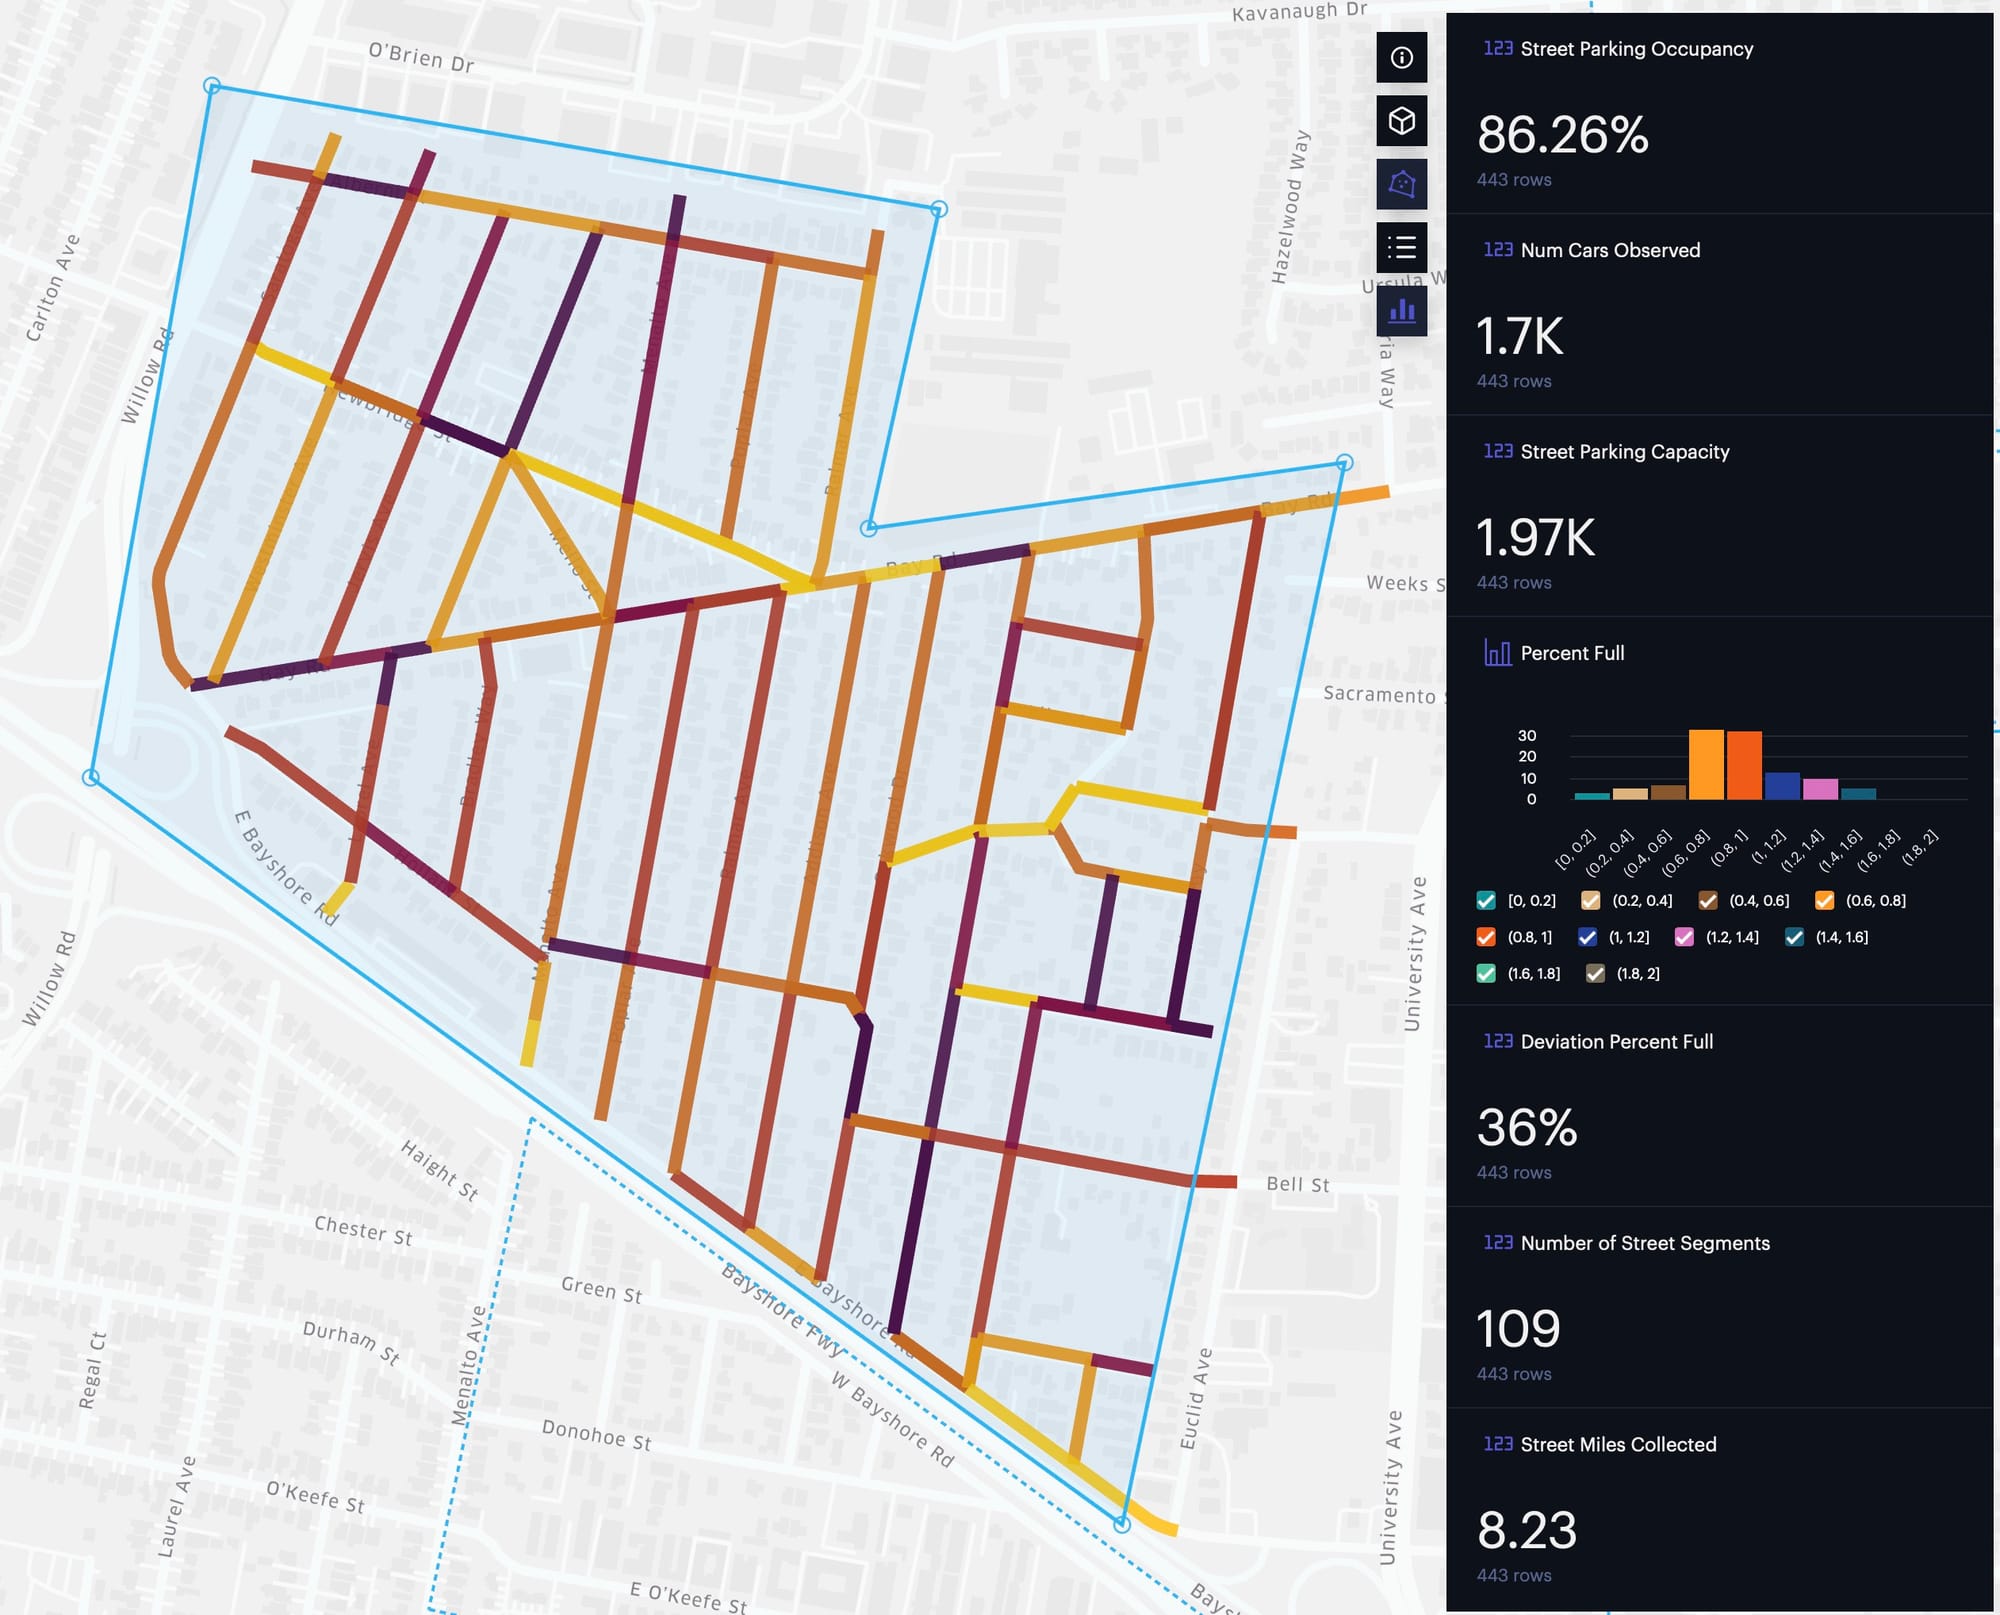
| Palo Alto Park | 86.26% | 1700 | 1970 | 8.23 |
| University Corridor | 96.59% | 396 | 410 | 1.64 |
| Kavanaugh Neighborhood | 111.40% | 391 | 351 | 1.46 |
Table 1. Parking occupancy percentage by neighborhood.
In order as displayed in the photo gallery: University Village, Ravenswood Business District, Weeks neighborhood, Gardens, West Side south of University, West Side north of University, Palo Alto Park, University corridor, Kavanaugh neighborhood
Underestimates the True Parking Occupancy
The reported parking occupancy percentages likely underestimate the true extent of the problem for four key reasons. First, data collection took place between 9:00 p.m. and 10:00 p.m.—earlier than the true peak period of 12:00 a.m. to 4:00 a.m., when most residents are home. Second, some data was gathered within 24 hours of trash collection, during which trash bins on the street can block available curb space, reducing the number of cars that can physically park. Third, certain nights preceded scheduled street sweeping, which may discourage residents from parking overnight on one side of the street to avoid morning fines. While this effect may be limited—as shown by the Kavanaugh neighborhood still reaching 111% occupancy despite pre-sweep timing—it could contribute to lower counts elsewhere. Finally, thermal imaging could not detect vehicles parked under dense tree canopies. Approximately 1–3% of street segments were obscured by trees, particularly in neighborhoods like Palo Alto Park and the city’s west side, where parking occupancy is likely even higher than recorded.
Findings from the Analysis
Parking Occupancy Increases Closer to University Ave
The University Village, Kavanaugh, and University Corridor neighborhoods—located close to University Avenue—exhibit very high parking occupancy rates exceeding 95%. Similarly, streets along the University Avenue corridor, such as Capitol Avenue, show parking occupancies between 102% and 113%.
University Village and Kavanaugh are predominantly lower-density, single-family home neighborhoods. Compared to older, pre-World War II neighborhoods like Palo Alto Park (AEI Housing Center), these areas feature newer post-World War II homes with larger garages and similar lot sizes (around 5,000 sq ft). Given this, one would expect their parking occupancy to be lower or comparable to Palo Alto Park’s 86% occupancy, not significantly higher at 96% and 111%, respectively.
A common explanation might be proximity to higher-density apartments on University Avenue, but this doesn’t fully explain the data. For example, many northern University Village street segments—located about half a mile from any apartment building—still exceed 100% occupancy. Capitol Avenue also experiences very high parking despite having few apartments nearby.
My hypothesis is that non-residents of East Palo Alto are storing vehicles overnight in these neighborhoods and retrieving them in the morning while commuting via University Avenue. The location of University Village and Kavanaugh offers convenient, on-the-way parking, much like stopping to fill gas. Several East Palo Alto residents have reported seeing multiple people arrive together by car in the morning, then disperse to take separately parked work vehicles, leaving their commuter cars on the streets overnight. This likely serves as a strategy to carpool from elsewhere in the East Bay while avoiding tolls by parking their work vehicles in East Palo Alto. I have personally observed this behavior on Pulgas Avenue and heard similar reports from friends in Kavanaugh and University Village.
Parking Occupancy Does Not Increase Near Menlo Park
Some East Palo Alto residents have reported that Menlo Park residents park their cars in East Palo Alto due to Menlo Park’s overnight parking restrictions. This has led to the hypothesis that our parking challenges are worsened by policies in neighboring cities.
However, our data does not support this claim. In Palo Alto Park, streets closest to Willow Road—adjacent to Belle Haven in Menlo Park—actually have lower parking occupancy rates than streets farther from Willow Road. This contradicts the expectation that Menlo Park residents would park nearest their own neighborhoods. A similar pattern appears on the West Side north of University Avenue, where streets closest to Menlo Park do not consistently show higher parking occupancy than those farther away.
Parking Occupancy Does Not Correlate with Building Height
Parking occupancy does not appear to correlate with building height. For example, as shown in Table 1, neighborhoods like University Village and Kavanaugh—comprised mainly of single-family homes—exhibit high street parking occupancy. In contrast, areas near taller buildings, such as the Light Tree Apartments, show relatively low occupancy. Specifically, our observations on Oakes Street west of Tate Street recorded occupancy rates between 42% and 72%, which is below the citywide average.
This suggests that factors other than building height—such as proximity to corridors like University Avenue—may play a more significant role in driving parking demand. This is an important finding because it challenges the commonly held assumption that building density drives parking demand. In this case, the data suggests that other factors—like location—may play a more significant role.
Problems with the Status Quo
An 84% street parking occupancy rate is dangerously high for any city—and the real number is likely even higher. This level of congestion has serious consequences: emergency vehicles may struggle to navigate blocked streets; drivers could find it difficult to evacuate during an emergency; and residents are increasingly engaging in verbal and even physical disputes over public parking spaces they’ve come to view as personal property.
People with disabilities are especially affected. In many cases, drivers—desperate for any available space—illegally park on street corners and in front of curb ramps, obstructing visibility and making intersections unsafe to cross. Double parking has become common, increasing traffic congestion. Some residents try to reserve public parking by placing trash cans in the street even on non-trash days.
I’ve seen the desperation firsthand. One evening, within a minute of launching my drone from Ralmar Avenue and Garden Street in the Palo Alto Park neighborhood, a frustrated driver parked in the middle of the road and accused me of moving their trash cans. I hadn’t—someone else had. The driver, enraged, began cursing at pedestrians, convinced one of them had taken “their” parking spot.
The situation worsens three days a week when trash is collected. Where can residents place bins without blocking driveways? Where do cars park when curb space is taken up by trash cans? Often, the problem just shifts between neighborhoods based on the trash schedule—never actually being solved.
Recommendations for the City
The City needs to take steps to decrease the demand for on-street parking. Here are my recommendations to decrease on-street parking demand while continuing to build more housing and a vibrant downtown:
- Continue to consider a residential parking permit program mainly because it will stop non-EPA parkers from taking advantage of our street parking simply because we are "on the way" for their commute. An RPP could even reduce the number of cut through trips on University Ave since there would no longer be a reason for those drivers to cut through on University Ave to get into their overnight-parked cars.
- Continue to make East Palo Alto's transportation network more multimodal. Being able to get around by foot, bike, or transit decreases the reliance on cars. Projects like the University Avenue overcrossing, East Bayshore pedestrian improvement project, and other sidewalk gap closure projects make it easier for residents to get around without a car. A family might then be able to downsize from 3 cars to 2 cars - or like my family downsize from 2 cars to 1 shared car - which decreases the demand for parked cars.
- Expand car sharing and micro-mobility options. Introduce car-sharing programs like Getaround or Zipcar to reduce the need for car ownership - especially second or third vehicles (more on this topic in this previous post).
- Launch a public education campaign on parking etiquette. Many conflicts stem from misunderstandings. A campaign (flyers, social media, signage) could clarify that public on-street parking spots do not belong to any home; why blocking sidewalks or double parking harms others; and why storing cars long-term on public streets limits access for neighbors.
While the supply of on-street parking remains largely fixed—and in some areas is actually shrinking due to new development and state requirements like daylighting laws—the City should take steps to manage and use that limited supply more efficiently. Here are two specific recommendations:
- Enforce the Existing Trash Can Ordinance to Prevent Curb Space Hoarding. The City needs to enforce its ordinance 18.22.070: "Single-family and multiple-family dwellings of three or fewer units shall store recycling, green or organic waste, and solid waste containers so they are either screened from public view from the public right-of-way or stored in the side yard of the premises behind the front of the dwelling. Containers may remain in public view during the 54-hour period commencing at 12:01 a.m. on the day preceding the day of scheduled pick-up and terminating at 6:00 a.m. on the day following the pick-up." Back in the October 8, 2019 City Council Study Session (Mobility Study memorandum, Page 6), Council acknowledged the urgency of this issue, stating that “Trash can enforcement needs to commence ASAP.” Yet six years later, residents continue using trash cans to “reserve” parking spaces that often go unused, effectively reducing the city’s available parking supply and worsening the overall problem. Case in point, on Thursday evening 6/19/25 we counted 377 trash cans left in the public right of way (on the street and on the sidewalks) in the Gardens neighborhood south of Sage Street, even though trash collection day is on Monday (see map visualization). Assuming 3 trash cans reduce 1 on-street parking spot, this reduced the number of parking spots by 126, which is around a 10.1% loss in parking capacity for that section of the Gardens which has 1,243 street parking capacity.
- Proactively Enforce the 72-Hour Parking Rule. To ensure street parking serves vehicles that are in regular use, the City should adopt a more proactive enforcement strategy for the 72-hour parking rule. Currently, enforcement is entirely complaint-based: a vehicle is only tagged once a resident reports it, and only then does the 72-hour countdown begin (see previous blog post). This passive system results in underutilized curb space. Other cities, like Palo Alto, use license plate recognition (LPR) technology to automate tracking of parked vehicles and identify violations. EPA could adopt a similar system, potentially outsourcing the function to a vendor like LAZ Parking, to ensure more consistent and efficient enforcement.
Privacy
The drone was kept over public streets, facing directly down, to avoid views into private property. The drone was flown to the highest altitude allowed by Palo Alto Airport airspace at that time, which is 400 feet when Class D airspace ends after 9pm each day. The thermal camera does not collect personally identifiable information as details on faces and details on people cannot be seen.
Conclusion
East Palo Alto’s residential streets are heavily congested with parked vehicles, with many neighborhoods consistently exceeding 100% parking occupancy. This comprehensive drone-based study confirms what residents have long reported: the parking crisis is real, severe, and systemic. In fact, the occupancy figures likely underestimate the true extent of the problem.
Notably, the highest parking saturation is found not in the densest or newest developments, but in lower-density, single-family neighborhoods adjacent to major corridors like University Avenue. This pattern suggests that factors beyond housing density—such as overnight vehicle storage by non-residents commuting via East Palo Alto—contribute significantly to parking demand and congestion.
As the city moves forward with policy decisions—whether implementing Residential Permit Parking, enhancing curb management, or increasing enforcement—this data provides an essential evidence base. Moving beyond anecdote, we now have a clear, data-driven understanding of the challenges East Palo Alto faces.
The time has come to adopt targeted, fact-based solutions that balance housing growth with equitable, safe, and accessible street parking for residents. Only by addressing this issue head-on can East Palo Alto ensure livable neighborhoods and functional streets for all.
Appendix
Data Collection Approach
For each street segment which is a section of a street between the 2 nearest street intersections, we use this equation:
Percent Street Parking Occupied = Number of Parked Cars Observed / Street Parking Capacity
The sections below go into detail on how the numerator and denominator of this equation were computed for each public street segment in East Palo Alto.
Number of Parked Cars Observed
Over multiple days and dozens of drone flights in June 2025 between 9pm - 10pm, my drone photography company Droneshot collected data on the number of cars parked on streets. The drone flew directly over public city streets and we manually count the number of cars on each street segment; every count is backed by corresponding video footage. The drone is equipped with a thermal camera which clearly shows cars, even in the dark.
We recorded the number of cars parked on each street segment in this Google My Maps: https://www.google.com/maps/d/edit?mid=1FgZL7xa-NC4XzeFSRGphfSZzRDhzGdY&usp=sharing.
Table 2 shows the data collection dates and the neighborhoods that were surveyed.
| Date | Neighborhood | Day of Week | Trash Collection? | Night before Sweet Sweeping? |
|---|---|---|---|---|
| 6/13/25 | Weeks | 2nd Friday | Yes, Friday | No |
| 6/18/25 | Palo Alto Park | 3rd Wednesday | Yes, Thursday | No |
| 6/18/25 | University Village | 3rd Wednesday | Yes, Wednesday | No, 2nd and 4th Thursday |
| 6/19/25 | Kavanaugh | 3rd Thursday | No | Yes, every Friday |
| 6/19/25 | Gardens | 3rd Thursday | No | No |
| 6/21/25 | Weeks | 3rd Saturday | No | No |
| 6/21/25 | West Side | 3rd Saturday | No | No |
| 6/23/25 | Ravenswood Business District | 4th Monday | No | No |
| 6/26/25 | West Side | 4th Thursday | No | Yes, every Friday |
| 6/26/25 | Weeks | 4th Thursday | Yes, Friday | Yes, some streets |
| 6/30/25 | Palo Alto Park | 5th Monday | No | No |
| 6/30/25 | University Corridor | 5th Monday | No | No |
Table 2. Dates of data collection, indicating the neighborhood, whether there was trash collection within 24 hours before/after, and whether it was the night before street sweeping.
Street Parking Capacity
This Google My Maps represents the street parking capacity of each street segment in East Palo Alto: https://www.google.com/maps/d/edit?mid=1vbvVtSOkQwHcjjq0EsiKGe-Gb3M4UXI&usp=sharing
For every street segment that was studied in the 2020 Mobility Study, we used the street parking capacity provided by Hexagon.
For the street segments not studied in the 2020 Mobility Study that were special in the sense that they were cul-de-sacs, dead ends, only allowed parking on one side, or were in commercial neighborhoods with fewer curb cuts than single family home neighborhoods, we used a similar approach to what Hexagon had used. We used Google Maps satellite and street views to count the number of 20 foot boxes that would fit on each street segment, in order to account for each car plus space around the car. Some intelligent rounding was used. For instance, if there only 15 feet of space between curb cuts, we rounded up to 1 parking spot capacity since some smaller cars could fit in that space. As another example, if there was 45 feet of space between curb cuts, we rounded down to 2 parking spots capacity because it would be very unlikely for 3 cars to fit.
For every other "normal" or "average" street segment - typically in single family neighborhoods defined by driveway curb cuts, stop signs, and occasional fire hydrants - we used this formula:
Max_cars = (street segment length in feet * 2 sides of street * (1 - 0.40 - 0.10) - 2 * 20 feet for daylighting) / 20 feet car length
Assumptions:
- Assume 2 20-foot segments lost to the daylighting law.
- Assume 40% of the street cannot be parked due to curb cuts
- Assume 10% more loss of parking for hydrants, intersections, bus stops, and buffer zones.
- Assume standard vehicle needs 20 feet of space to park
Lastly, we ignored all streets that have no parking available on either side, such as University Ave and some parts of Donohoe St north of Highway 101.
Averaging
If a street segment was recorded on multiple days, we averaged the vehicle count over the days to compute the street segment's percent parking occupancy.
Ignored Private Roads
All private roads were ignored. We cross-references a list of public / private roads obtained from the East Palo Alto public works department.
Foursquare Studio
If you would like to do your own polygon filtering in Foursquare Studio, follow these steps:
- Click on the "Draw on Map" icon on the top right.
- Click on "Polygon."
- Draw your polygon.
- Right click on your polygon (blue) on the map, click on "Filter Layers", and click on the layer.
- The map visualization should immediately refresh to show only the street segments which intersect the drawn polygon, and the charts on the right dashboard should reflect the filtered street segments.