We created this map visualization of vehicle collisions in East Palo Alto. So far, we have obtained data from the East Palo Alto Police Department for January 1, 2024 through June 30, 2025 (18 months).
Here is the link: https://studio.foursquare.com/map/public/af47803e-4489-414f-8bd3-d4444c486685
Feel free to make changes on the map visualization; any changes you make will not change the original map. Have fun exploring the data!
Polygon Filtering
If you would like to do your own polygon filtering in Foursquare Studio, follow these steps:
- Click on the "Draw on Map" icon on the top right.
- Click on "Polygon."
- Draw your polygon.
- Right click on your polygon (blue) on the map, click on "Filter Layers", and click on the layer.
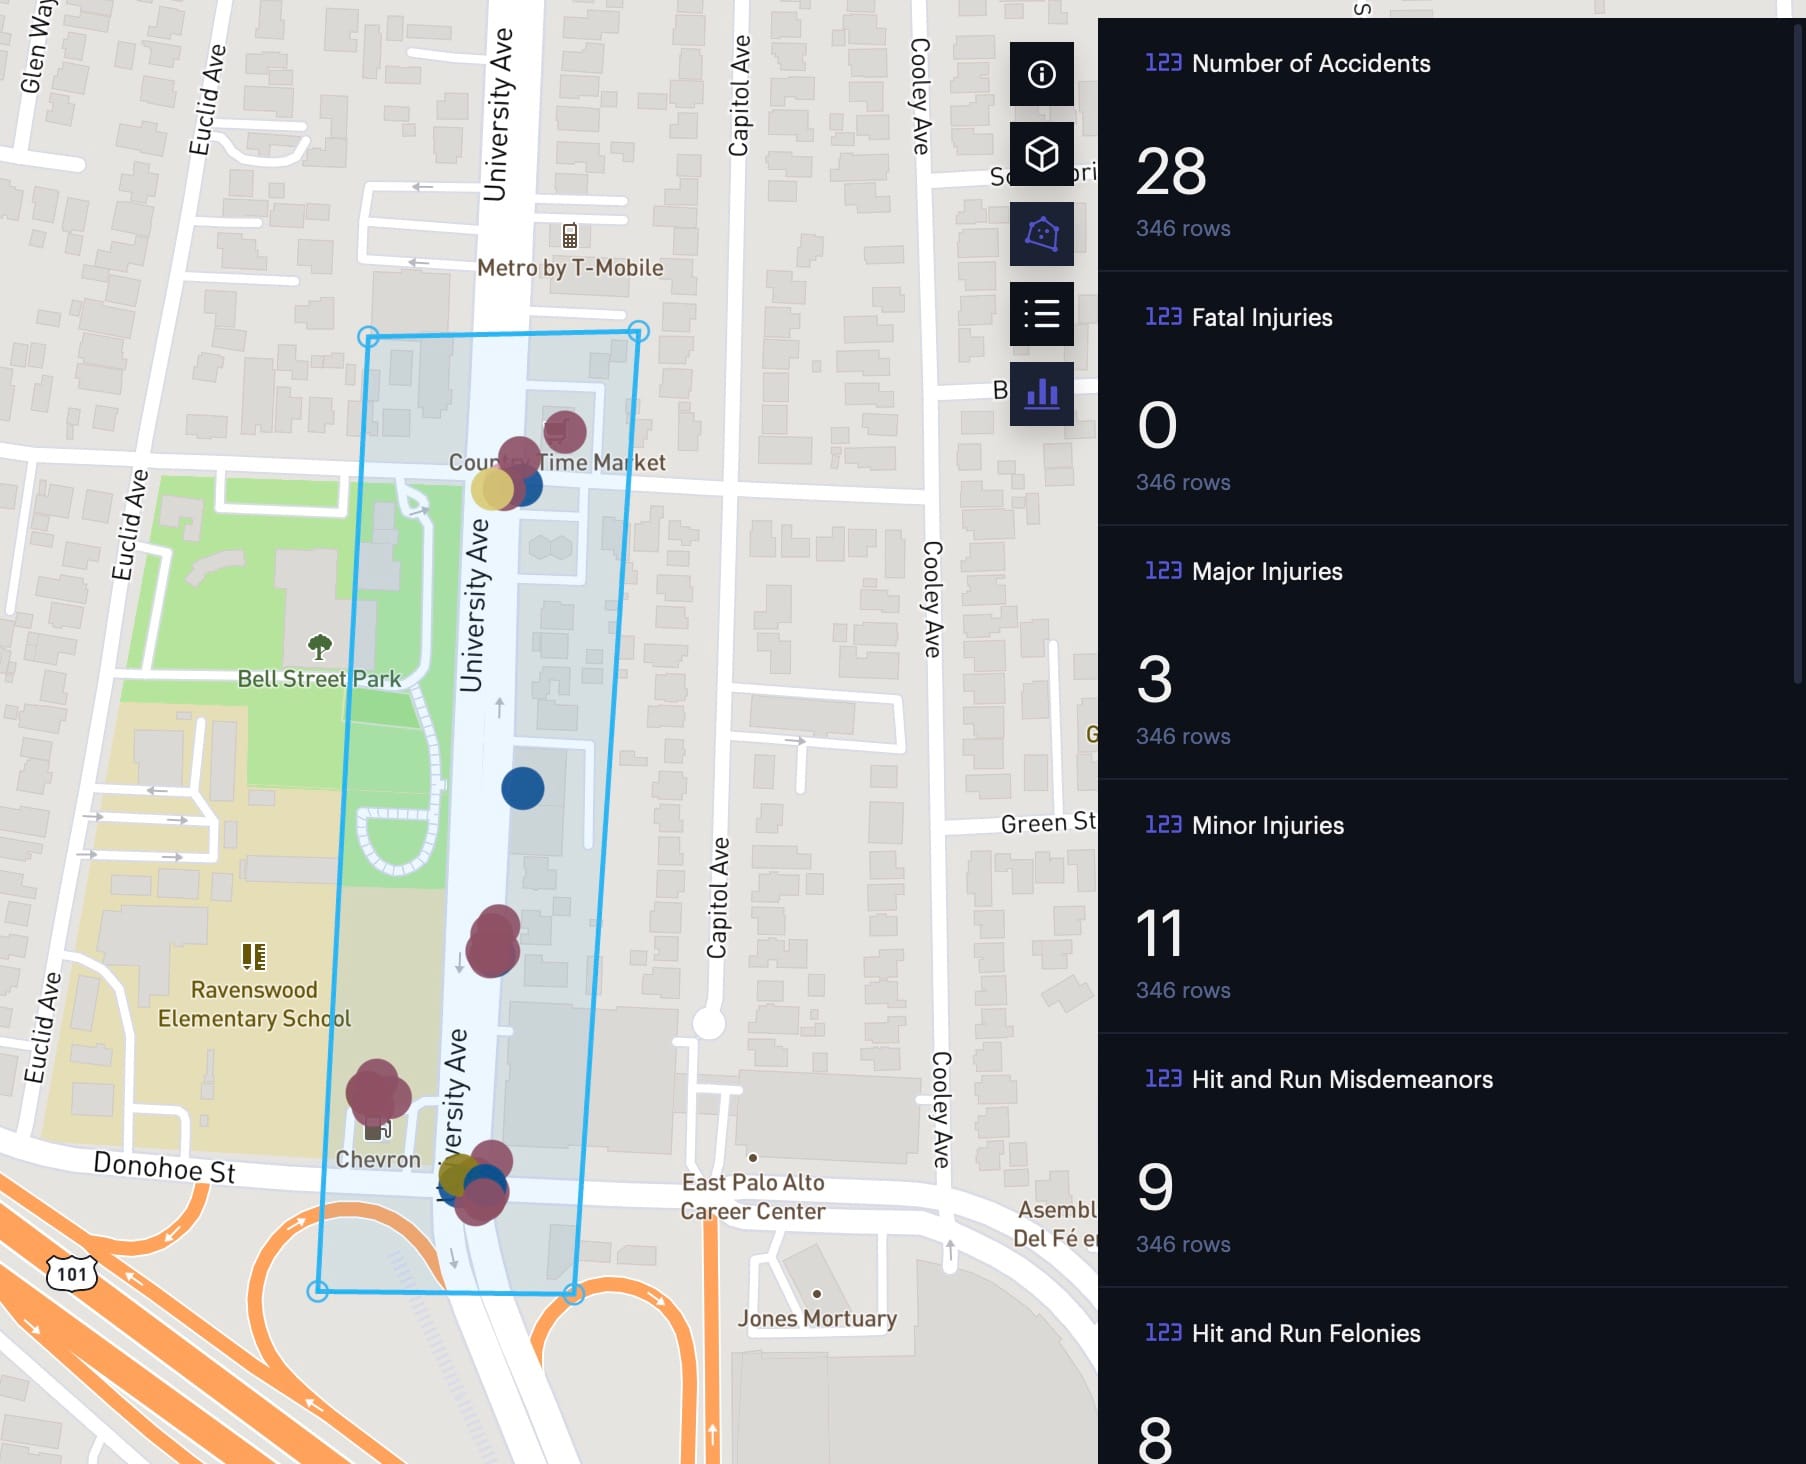
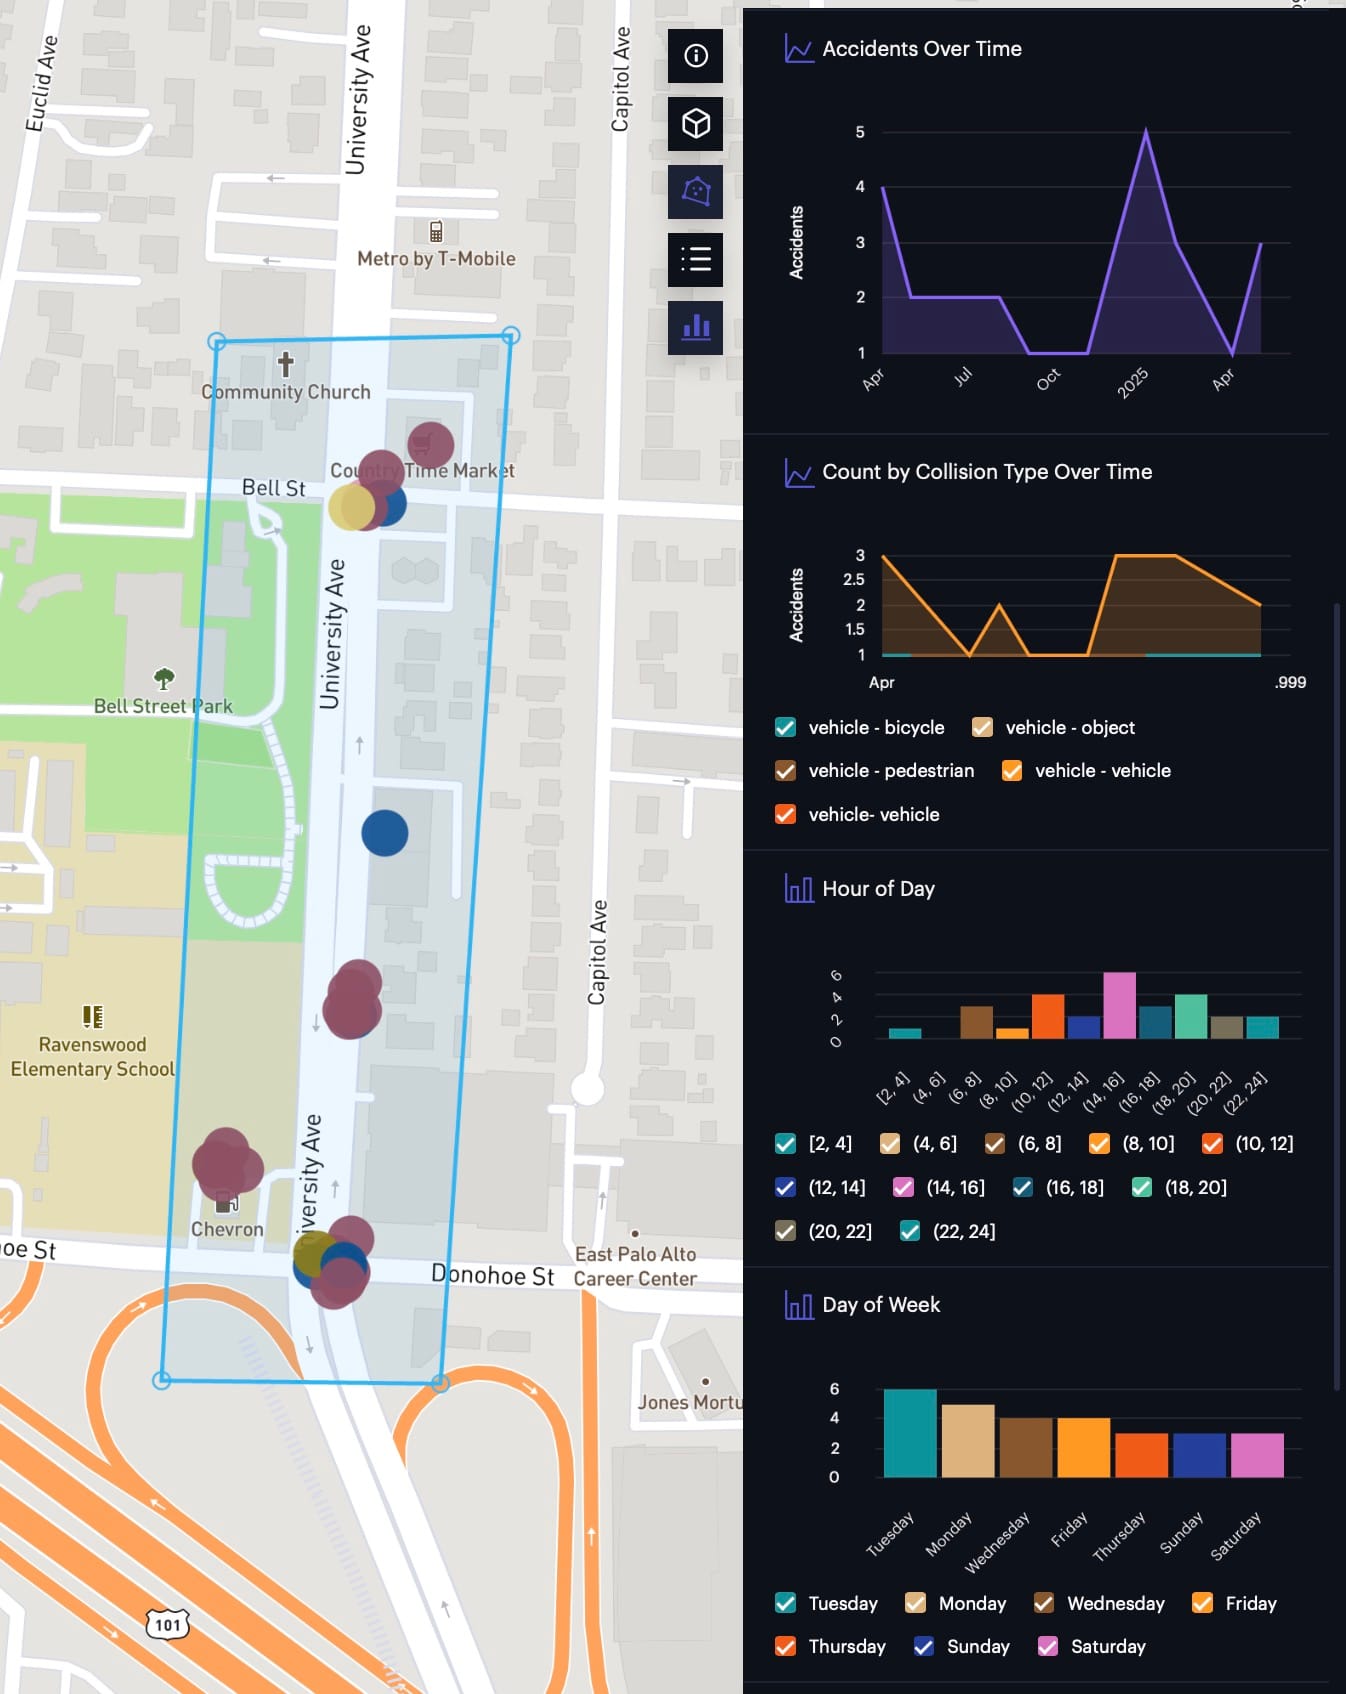
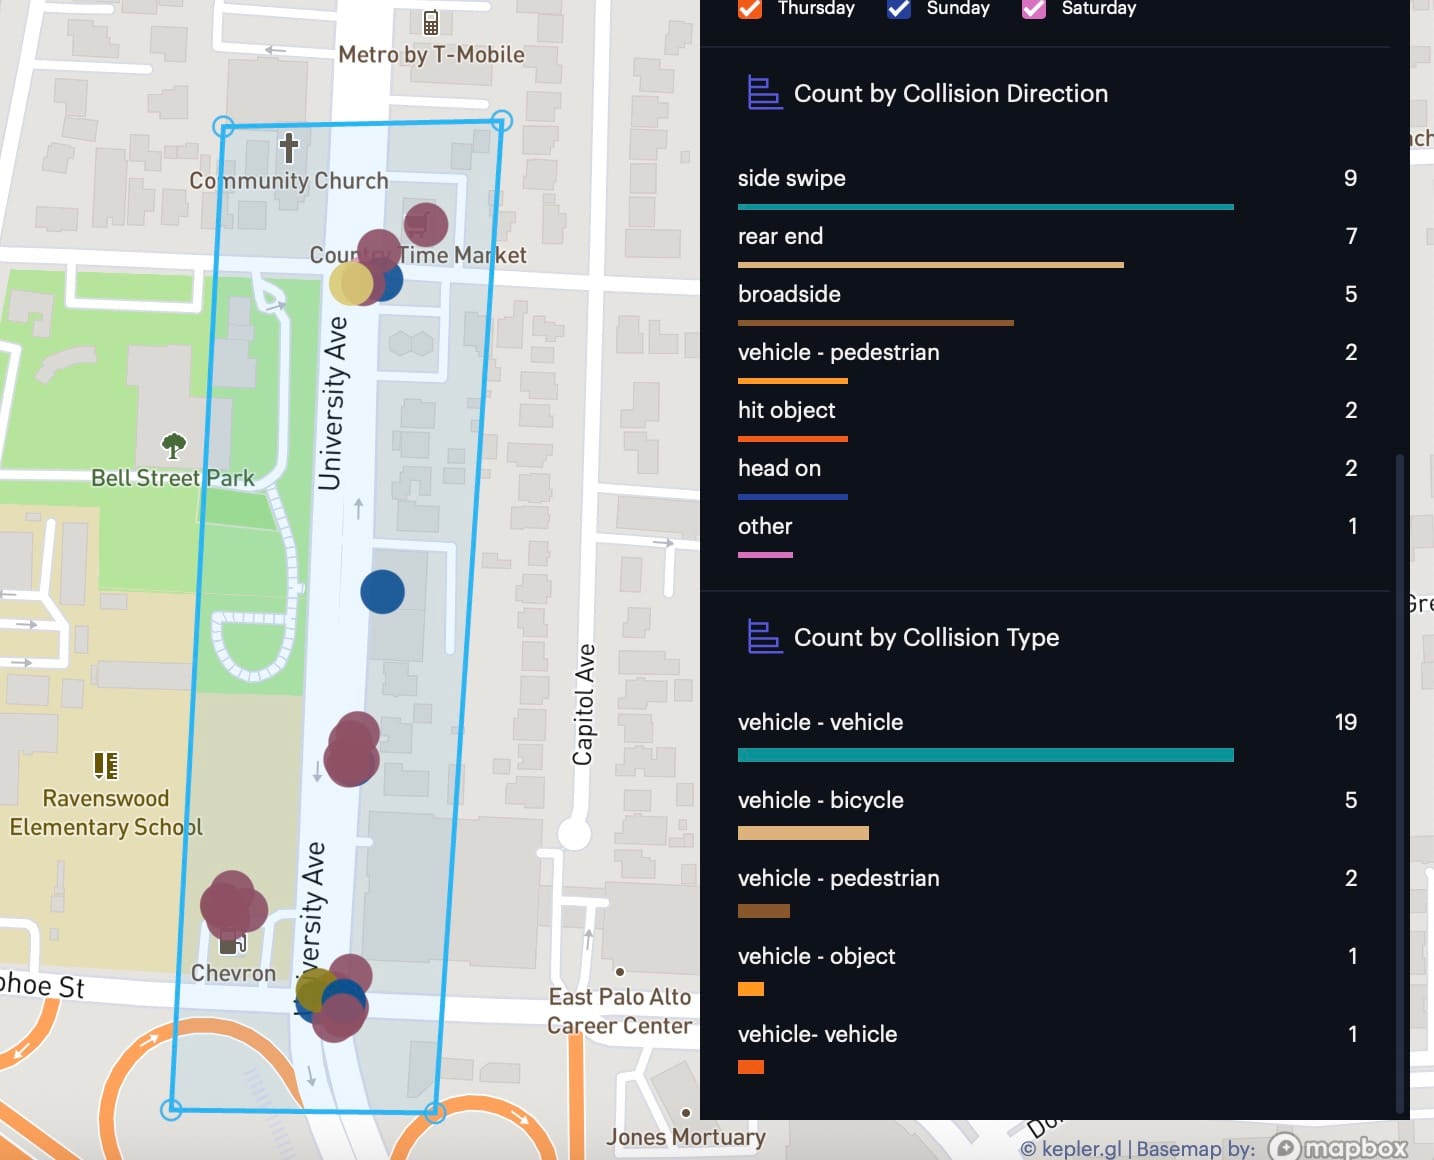
- The map visualization should immediately refresh to show only the street segments which intersect the drawn polygon, and the charts on the right dashboard should reflect the filtered street segments.
The charts will show statistics for vehicle collisions that occurred within the polygon area, as shown below.