From Public Records Act Request to Interactive Map: Processing Vehicle Collision Data for Geospatial Analysis
Learn how to obtain, clean, geocode, and visualize vehicle collision data using Google Sheets and Foursquare Studio. This step-by-step guide turns raw police records into actionable geospatial insights for safer streets.
Note: this is a technical blog post targeted towards readers interested in data processing and geospatial map visualization. The purpose of this blog post is to share the administrative and technical steps needed to obtain and process vehicle collision data, in order to view it in a geospatial map.
Context
This year I've worked a lot with geospatial data in the context of illegal trash dumping, zoning maps, overnight parking drone studies, vehicle collisions, and more. Prior to this, I had no experience with geospatial analysis, but I did have experience with Grafana dashboards and other types of data visualization used in software engineering.
One of the data sets that I've been working a lot with is vehicle collisions. It turns out that the California Highway Patrol has a website that does exactly this: SWITRS. The problem though is that in many cases the most recent vehicle collisions from the last few months to 2 years do not show up due to a lag in data submission and processing.
Why do this myself?
I started looking into vehicle collisions in June 2025 when I noticed East Palo Alto and neighboring cities appeared to have a sharp increase in the number of pedestrian and bicycle fatalities and collisions. Within that 30 day span, Atherton had a bicycle fatality; Redwood City had a pedestrian fatality; East Palo Alto had a pedestrian fatality; and Palo Alto had a pedestrian fatality. When an East Palo Alto resident made a public comment about seemingly noticing a trend of 3 bicycle collisions along East Palo Alto, my ears perked up and I looked for the data to see if there was something going on. I wanted to use the data to make several posts to raise awareness on the issue and to advocate for street changes with our City of East Palo Alto public works department.
Initially, I tried to look up the vehicle collision data in the California Highway Patrol SWITRS database using the Berkeley Transportation Injury Mapping System (TIMS). I quickly realized that the most recent vehicle collisions did not show up due to a lag in police department submitting and then the California Highway Patrol processing the data. In my case, I could not see data after March 2025 when I was trying to find collisions in June 2025. Some professional transportation engineers I spoke to said they sometimes could not find data from the last 2 years. This is a real problem when those same transportation engineers are tasked with modifying roads to improve road safety. How are we supposed to improve road safety when we don't even know how many people got injured on that road in the last few months or couple of years?
How to Guide
For purposes of this guide, I will be using 2024 vehicle collisions data which I obtained from the Atherton Police Department by submitting a Public Records Act request. I chose to use Atherton because there was a bicycle fatality in May 2025, and I wanted to see if there was a trend leading up to the incident.
Prerequisites
For this guide you will need access to these free services:
- Google Sheets
- a Google Cloud API key for geocoding
- a Foursquare Studio account
Step 1. Submit a Public Records Act request for vehicle collision data
Most cities do not publish the vehicle collision data, but the data is supposed to be made available publicly via a Public Records Act (PRA) request. If you haven't submitted a PRA request before, you can typically find it on the city's website under a "Submit a Request" button. These are links for the cities I had submitted PRA requests for.
East Palo Alto: https://www.cityofepa.org/contact
Palo Alto Police: https://www.paloalto.gov/Departments/Police/Public-Information-Portal/Request-Police-Records
Atherton: https://www.ci.atherton.ca.us/FormCenter/City-Clerk-4/Public-Records-Request-56
In my experience, the request has typically taken 1 to 4 weeks to arrive, and I received it via email in the form of a Microsoft Excel .xls file. In some cases, I had to manually clean up some data where there were different numbers of spaces in categories, such as "Vehicle - Vehicle" vs "Vehicle- Vehicle" vs "Vehicle -Vehicle."
Step 2. Add columns for latitude, longitude, and timestamp in Google Sheets
The main reason I chose to do data augmentation in Google Sheets was that Google Sheets could hook into a geocoding Apps Script function which could convert the address into latitude/longitude directly in the Google Sheet. Previously when I was analyzing Ride Plus trips which I wrote about here, I had to write a custom Python geocoding script, and then I had to manually move the data into the original spreadsheet which was very inefficient.
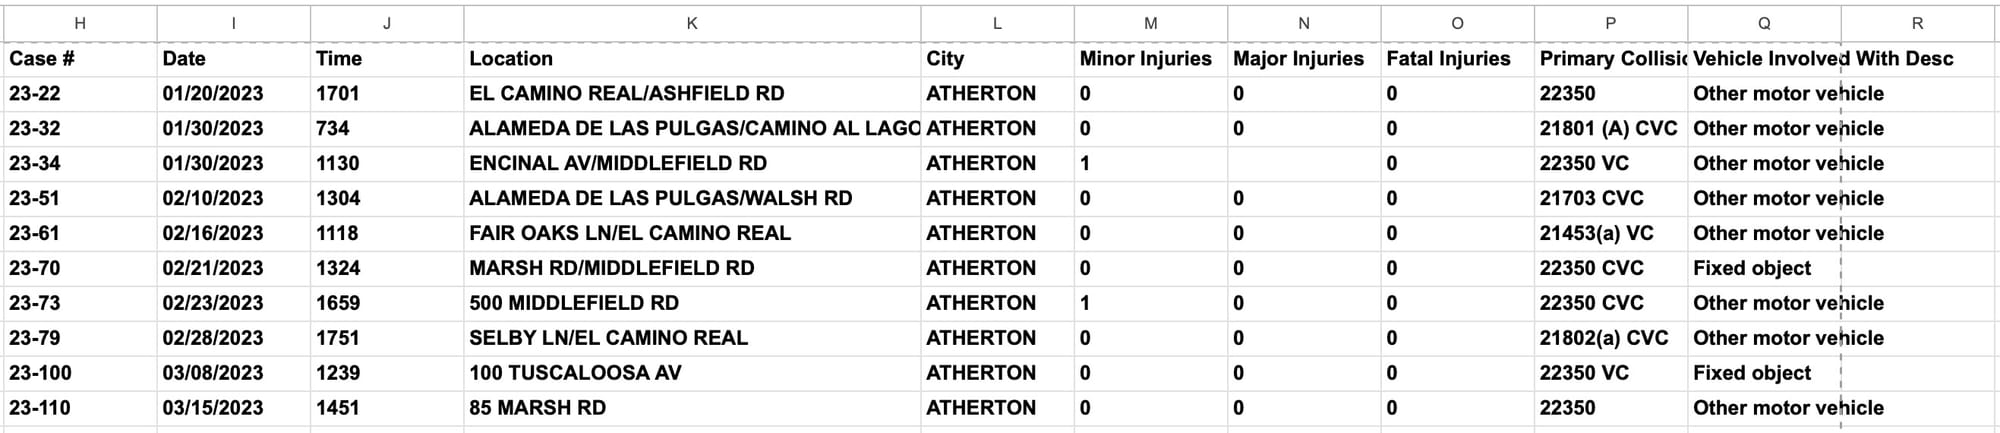
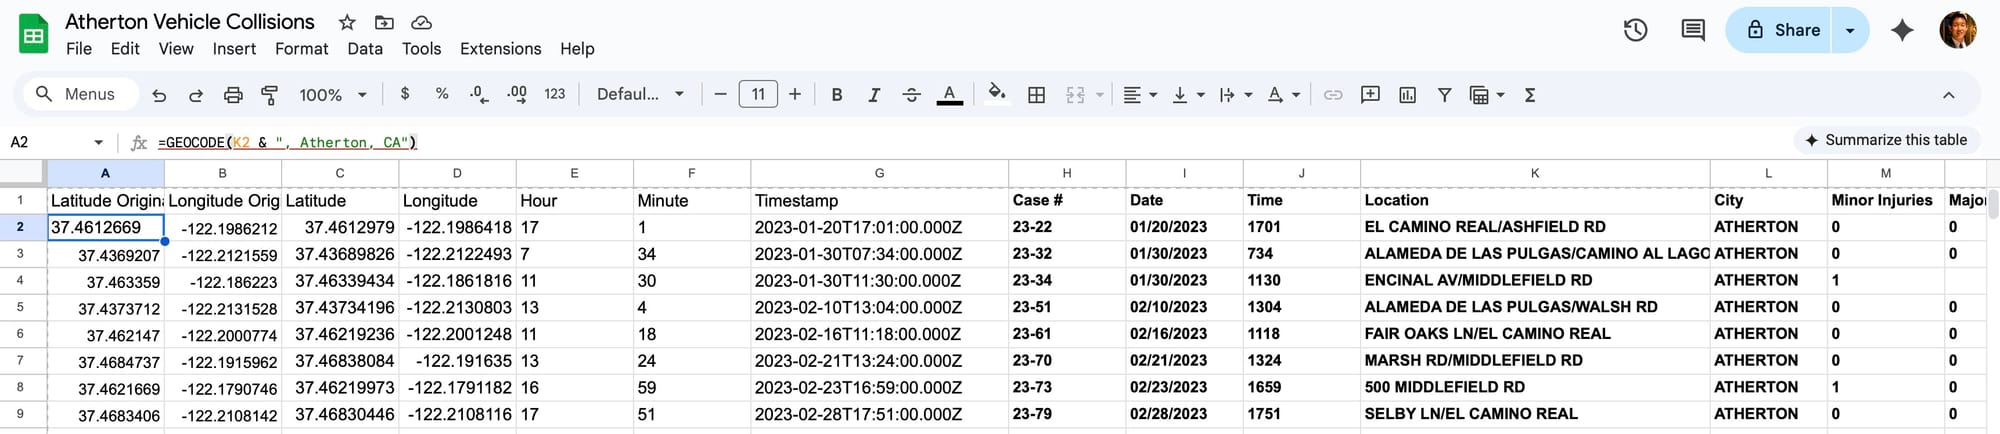
The first screenshot shows the raw vehicle collision data pasted into Google Sheets. The second screenshot shows 7 new columns I added for latitude, longitude, hour, minute, and timestamp.
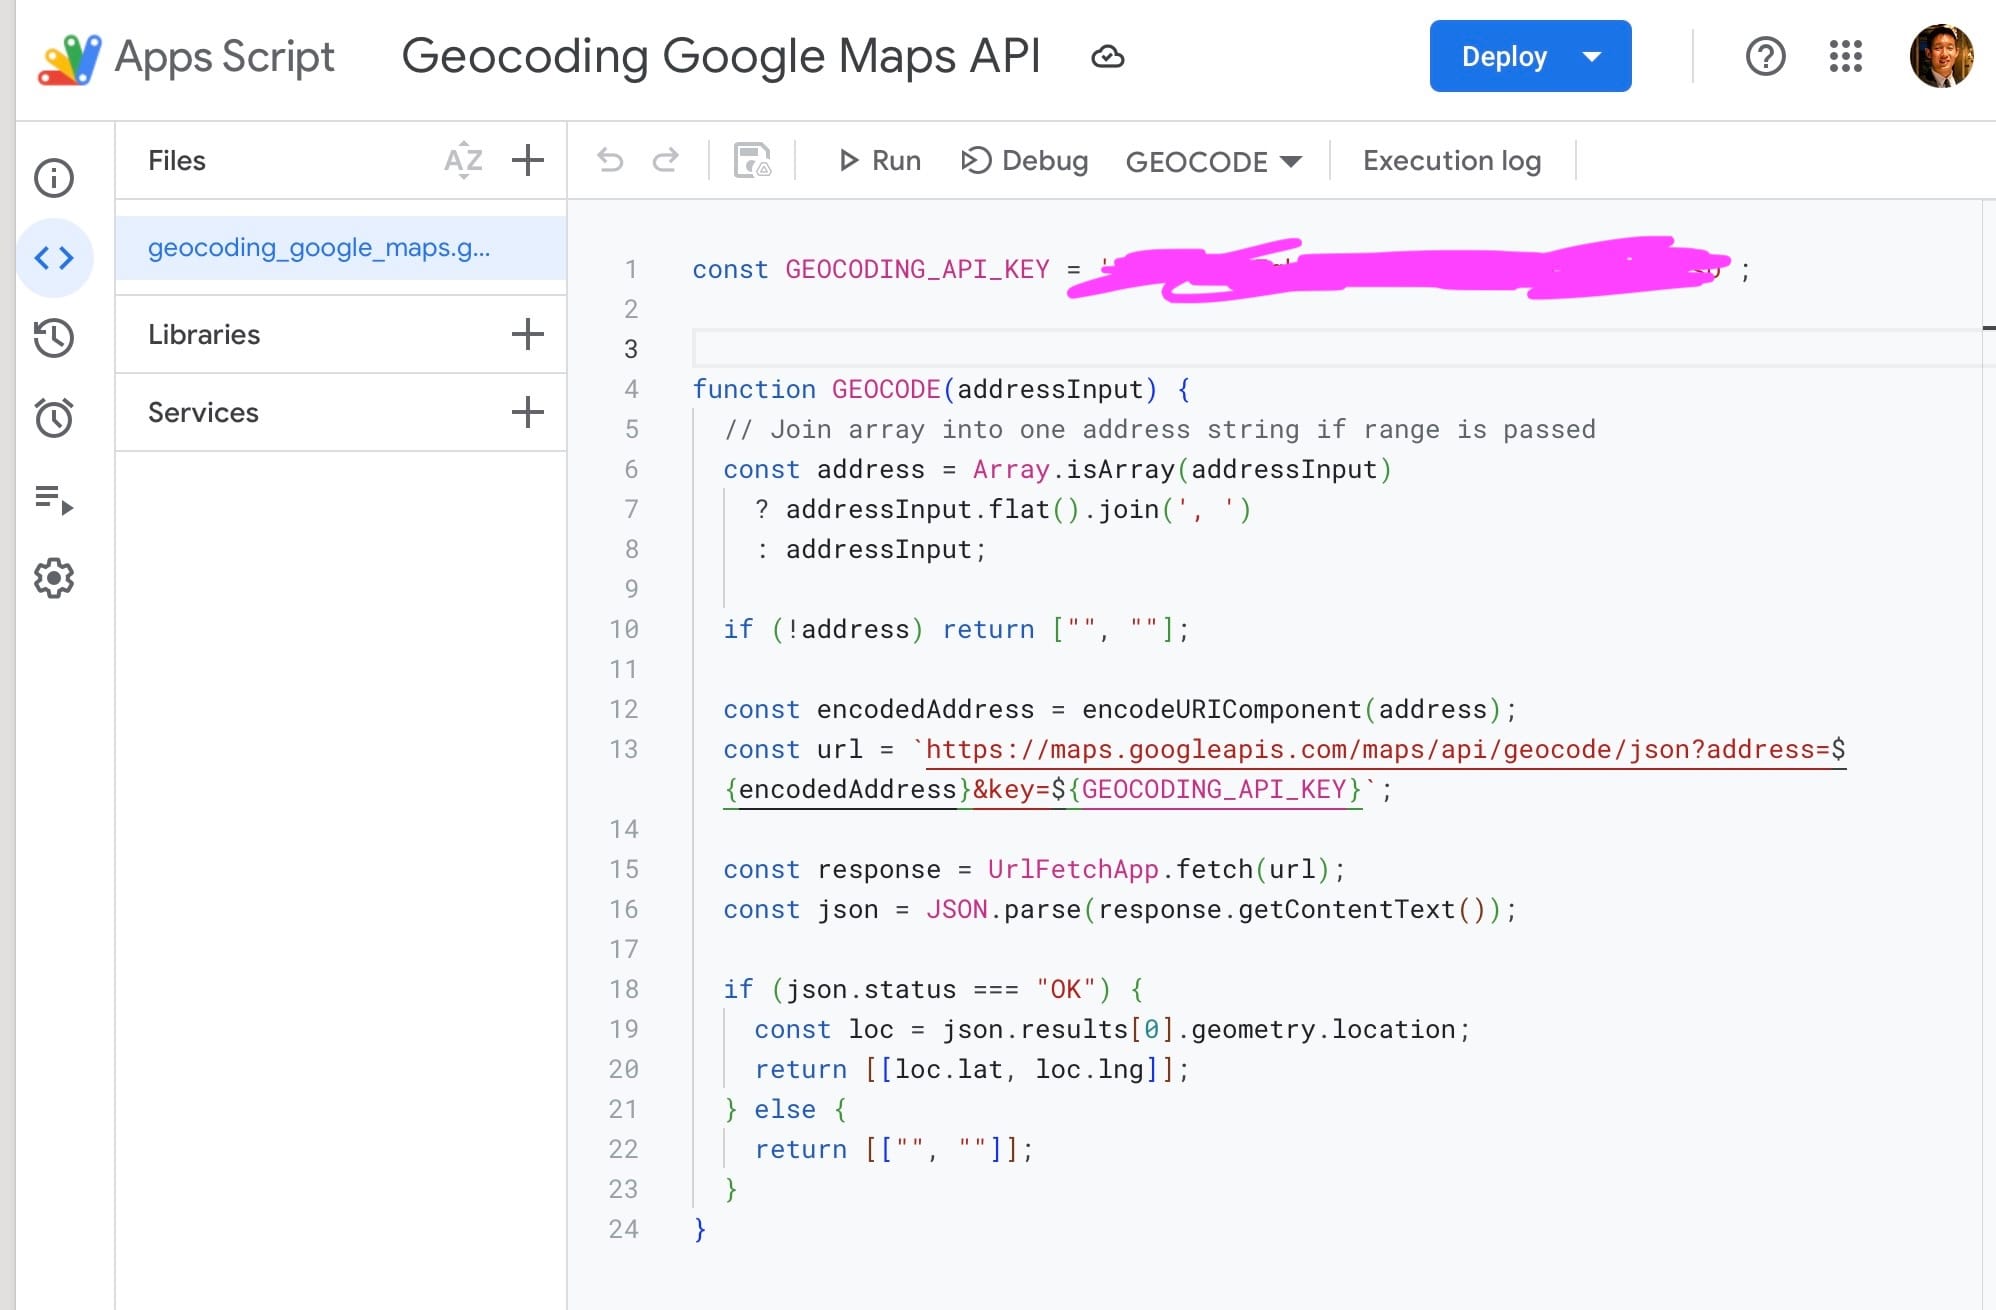
First, I needed to setup a Google Sheets App Script. Go to Extensions -> Apps Script. I then created a new function called GEOCODE with this following code which I can really thank ChatGPT for:
const GEOCODING_API_KEY = '<INSERT YOUR KEY HERE>';

function GEOCODE(addressInput) {
  // Join array into one address string if range is passed
  const address = Array.isArray(addressInput)
    ? addressInput.flat().join(', ')
    : addressInput;

  if (!address) return ["", ""];

  const encodedAddress = encodeURIComponent(address);
  const url = `https://maps.googleapis.com/maps/api/geocode/json?address=${encodedAddress}&key=${GEOCODING_API_KEY}`;

  const response = UrlFetchApp.fetch(url);
  const json = JSON.parse(response.getContentText());

  if (json.status === "OK") {
    const loc = json.results[0].geometry.location;
    return [[loc.lat, loc.lng]];
  } else {
    return [["", ""]];
  }
}
After clicking save, navigate back to your Google Sheets spreadsheet and you will notice that you can use the =GEOCODE function.
In the Atherton Vehicle Collisions spreadsheet, I used these following formulas:
| Column | Google Sheet Formula |
|---|---|
| Latitude | = GEOCODE(K2 & ", Atherton, CA") |
| Longitude | filled in from equation above |
| Latitude Offset | = A2 + (RAND() - 0.5) * 0.0002 |
| Longitude Offset | = B2 + (RAND() - 0.5) * 0.0002 |
| Hour | = ROUNDDOWN(J2/100,0) |
| Minute | = MOD(J2,100) |
| Timestamp | = TEXT(DATEVALUE(I2) + TIME(E2, F2, 0), "yyyy-mm-dd""T""hh:mm:ss.000""Z""") |
Notice how we used the GEOCODE function Apps Script to create the first 2 columns for latitude and longitude. After that, we apply a random offset to the latitude and longitude; we do this so that vehicle collisions that occurred at the same intersection / address do not end up covering each other completely on the Foursquare Studio map (to be discussed in the next step).
I also used formulas to compute the hour and minute. I noticed that the police departments in our adjacent cities that use SunRidge Systems RIMS (records management system) export time in an odd 4 digit format such as 1812 which represents 6:12pm. Hence I do a division by 100 or a mod by 100 to extract the hour and minute, which is useful for analysis later.
Lastly, I use the hour, minute, and date to create a timestamp string. This is very helpful later in Foursquare Studio to plot trends over time.
To apply the formula to every row, click on the cell in one row and drag the bottom right corner of the cell down to apply the same formula to all other rows.
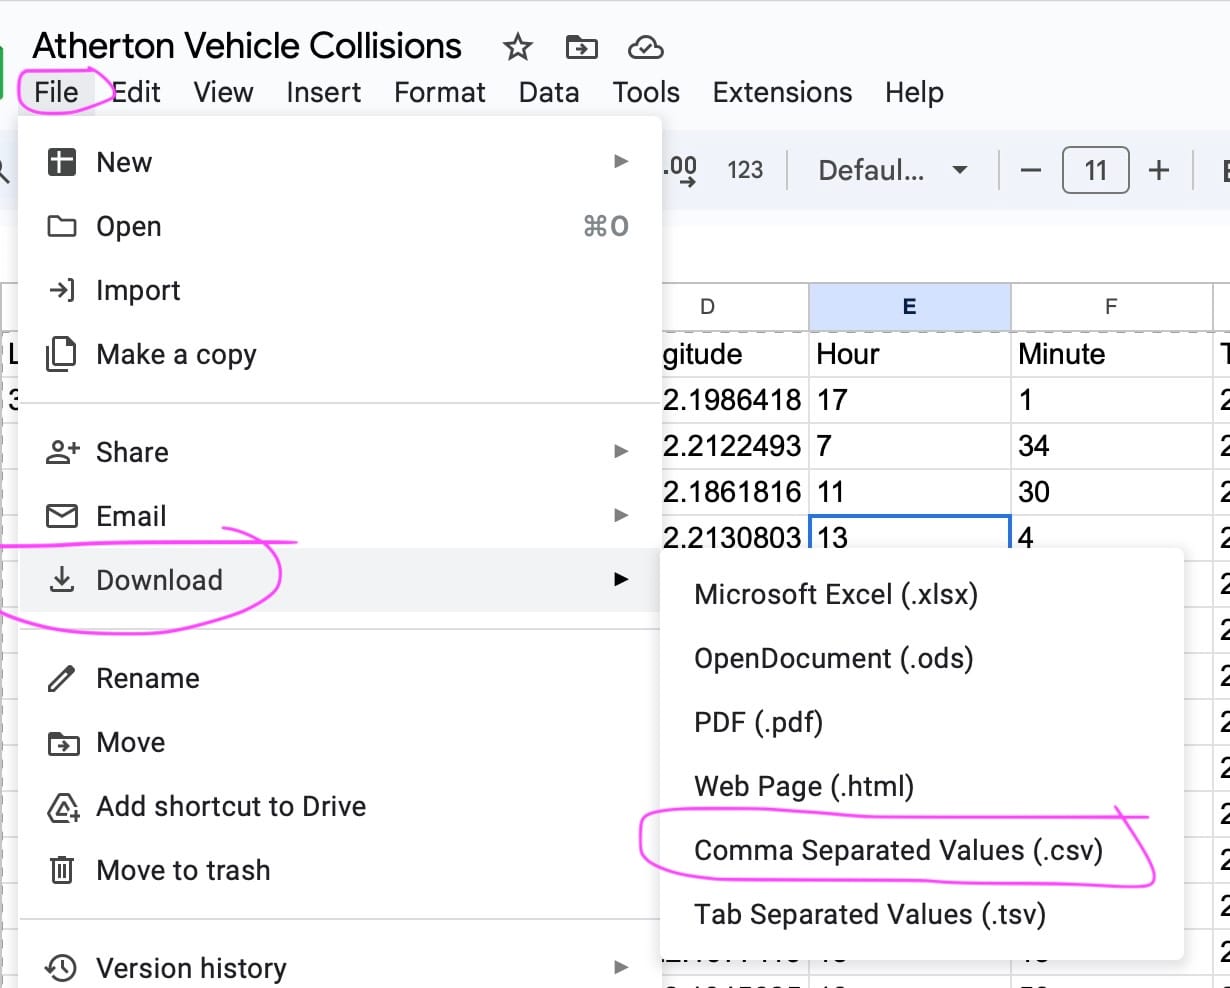
Step 3. Export the Google Sheets spreadsheet as a CSV
Click on File -> Download -> CSV.
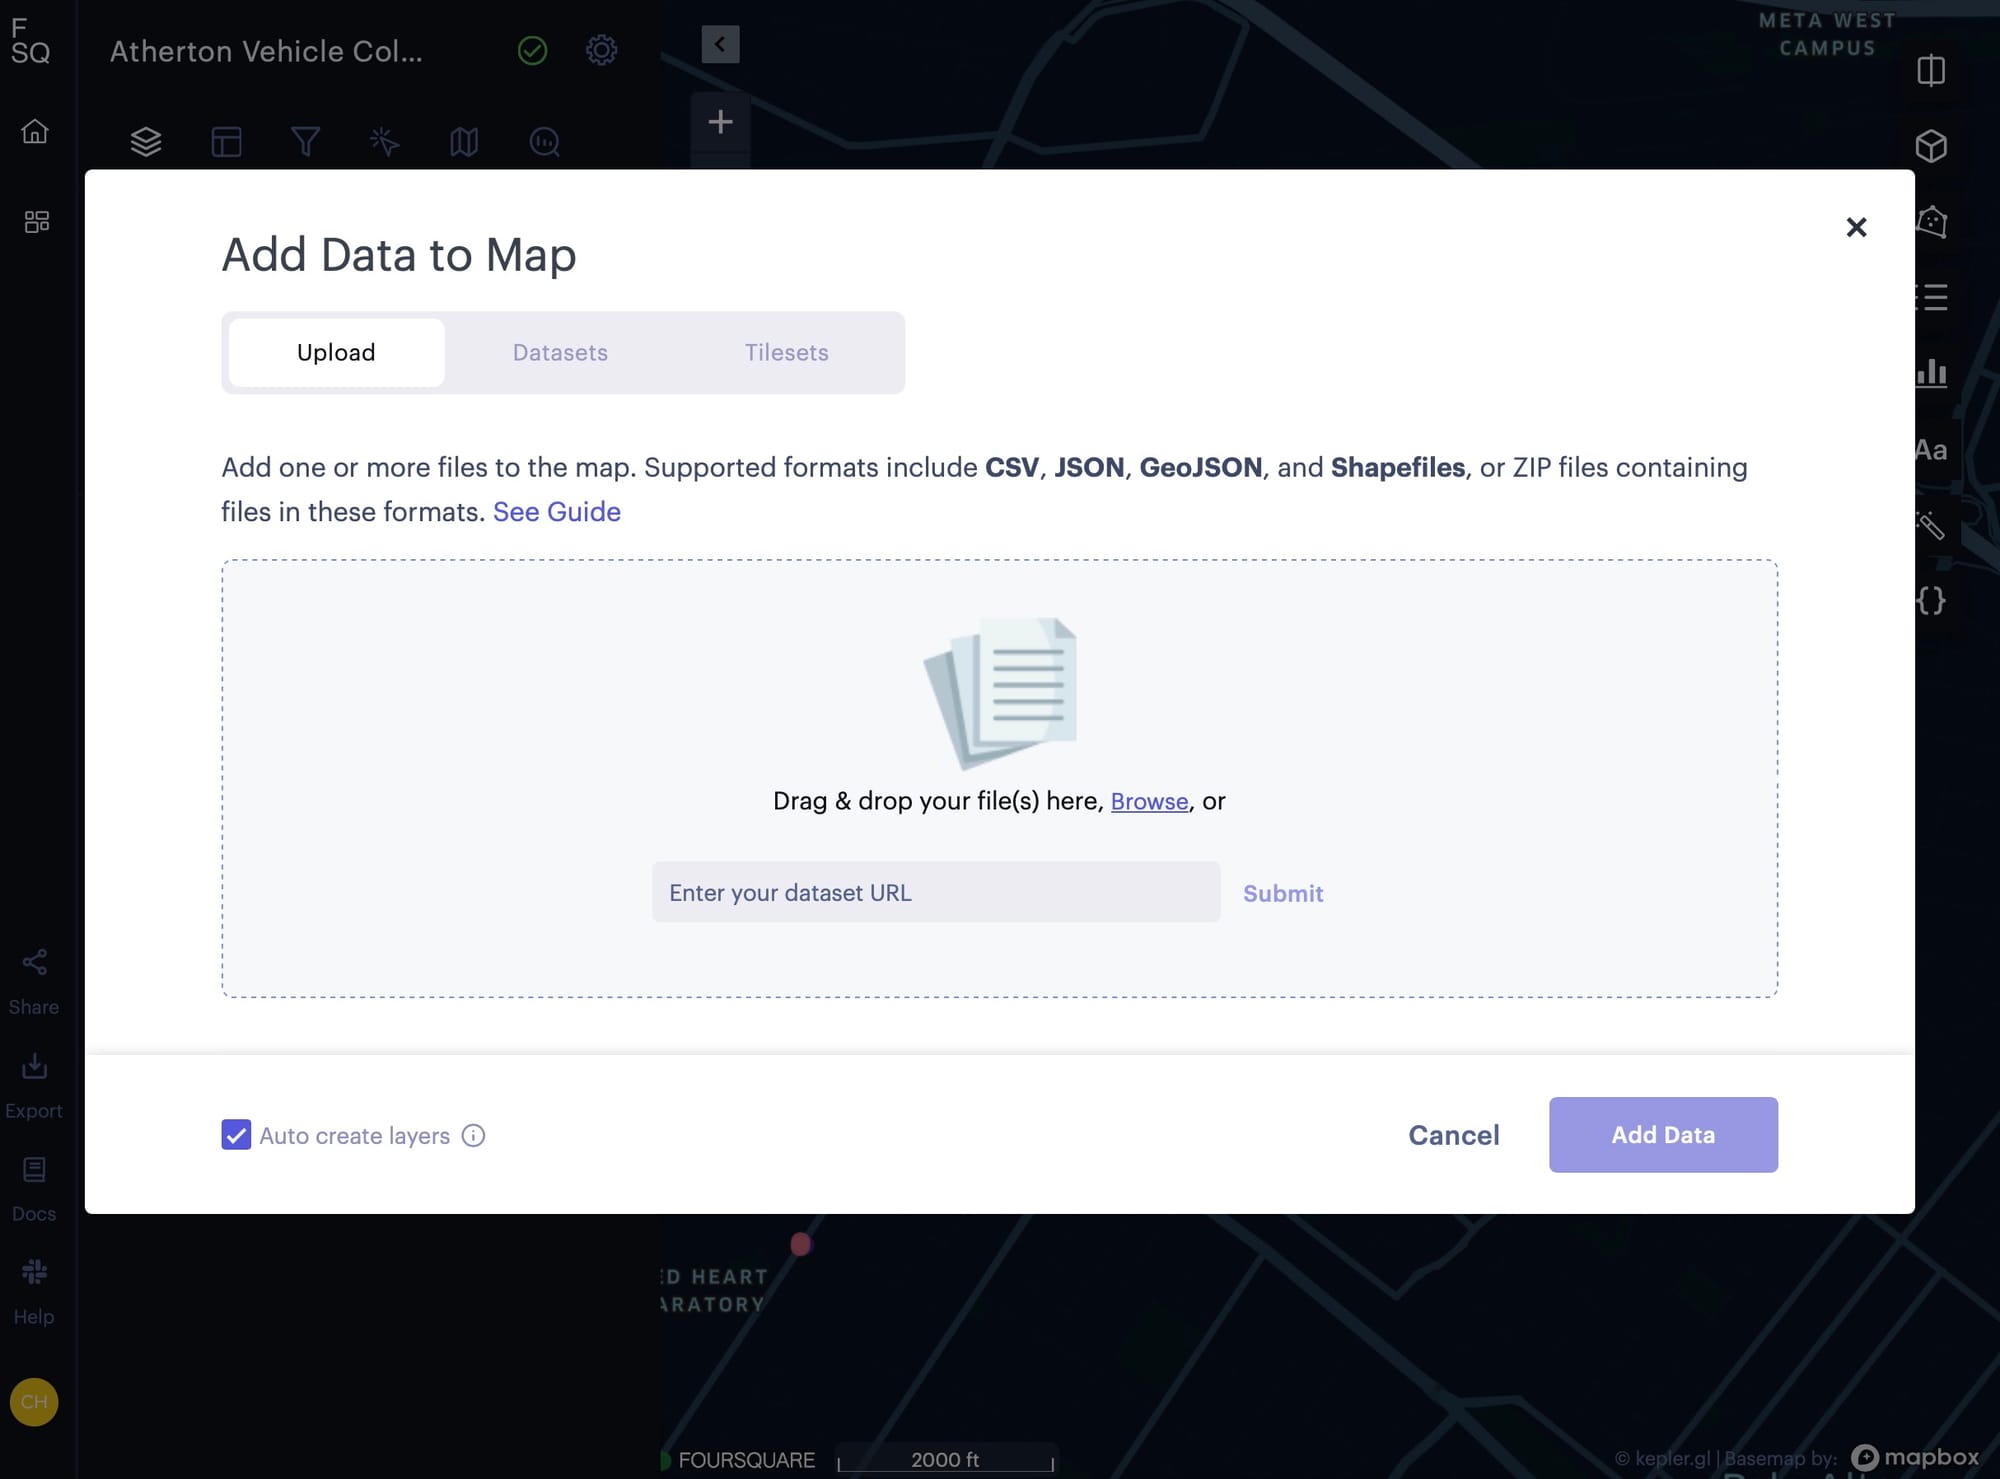
Step 4. Create a Foursquare Studio map
At this link above, you'll want to create a free account. I've really enjoyed using Foursquare Studio because it has powerful visualization tools and is free. Foursquare Studio is actually a fork off of Uber's Kepler.gl web visualization library, with added features such as being able to create new maps and save your data.
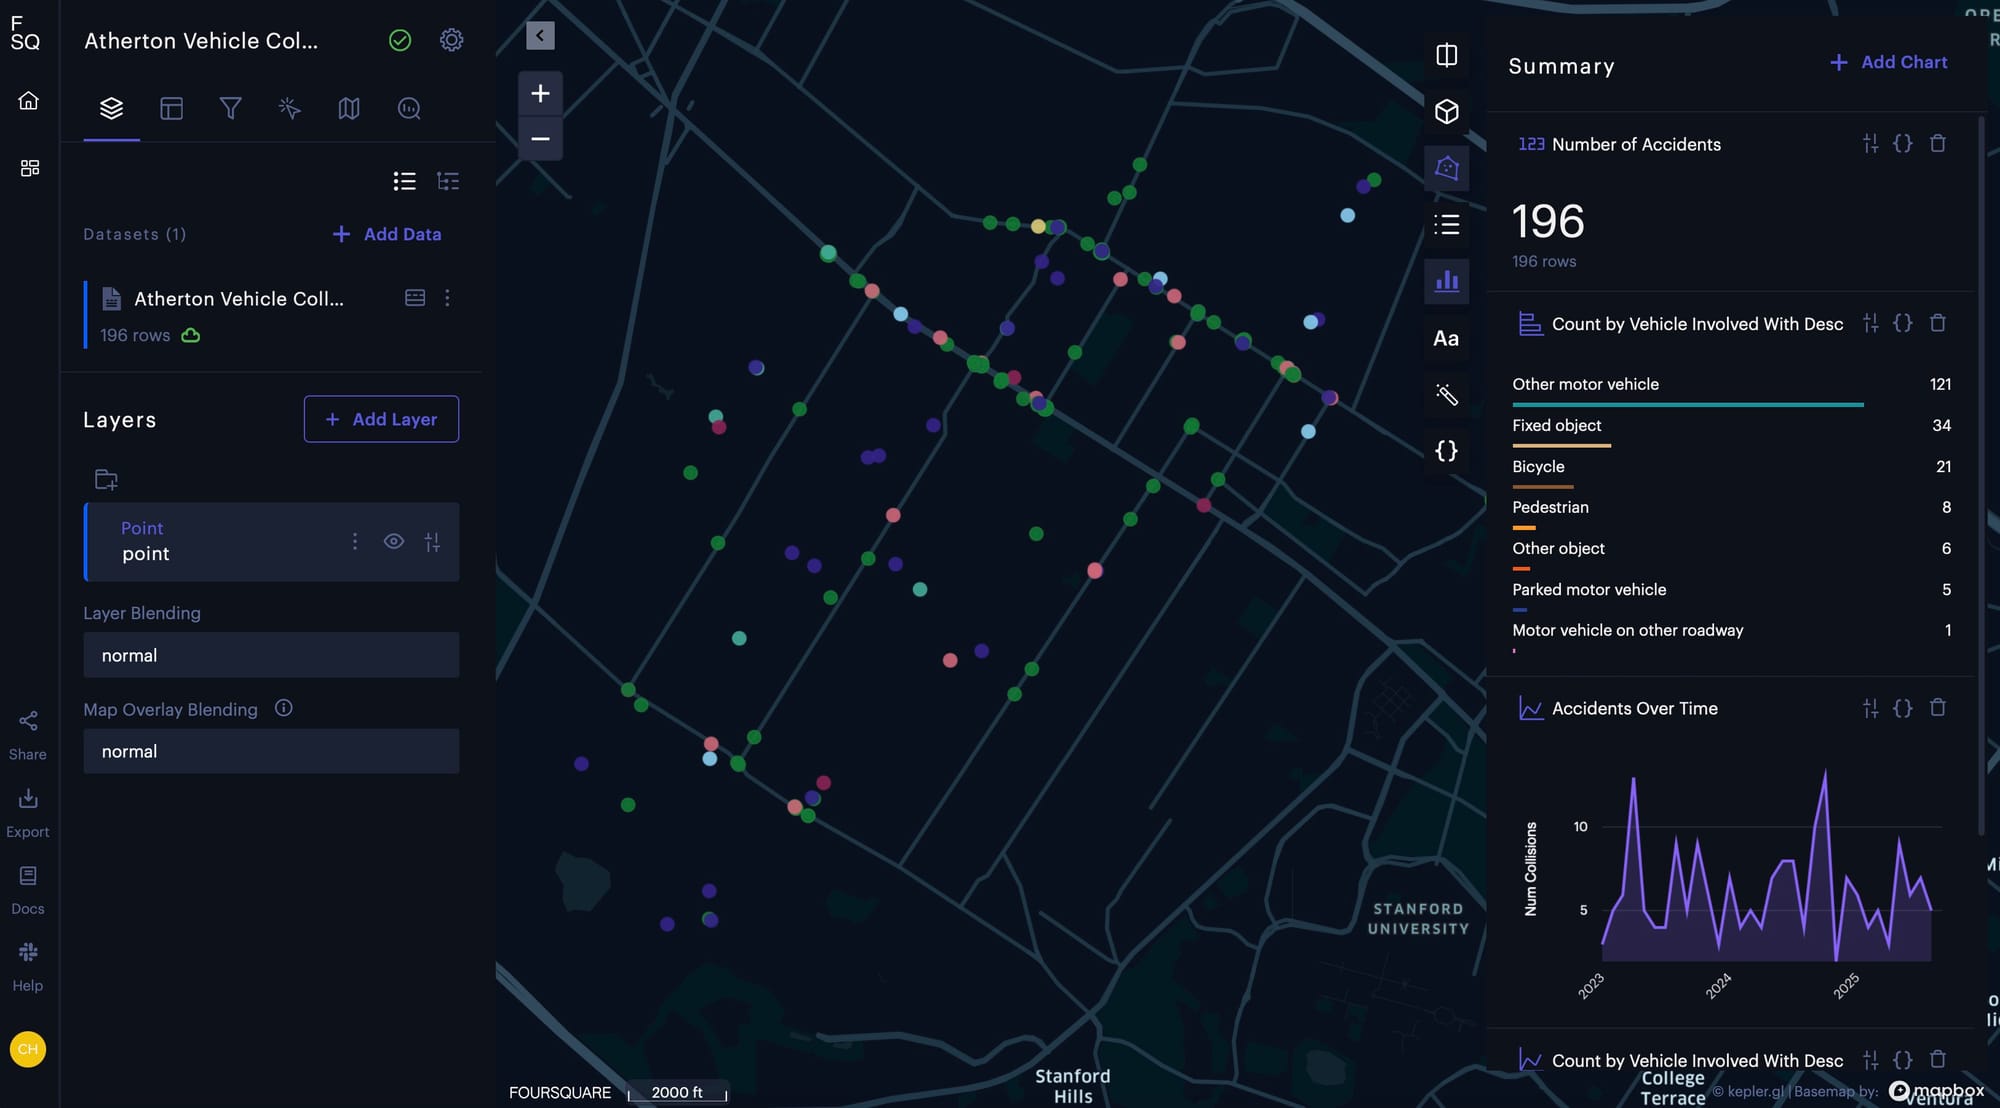
You can reference this map to see how I plotted vehicle collision data in Atherton, CA: https://studio.foursquare.com/map/public/26229025-e4e6-48e8-bbd3-4110bf8bf1bf.
Now that we have a new map, click on "+ Add Data" and drag in your CSV file from the previous step.
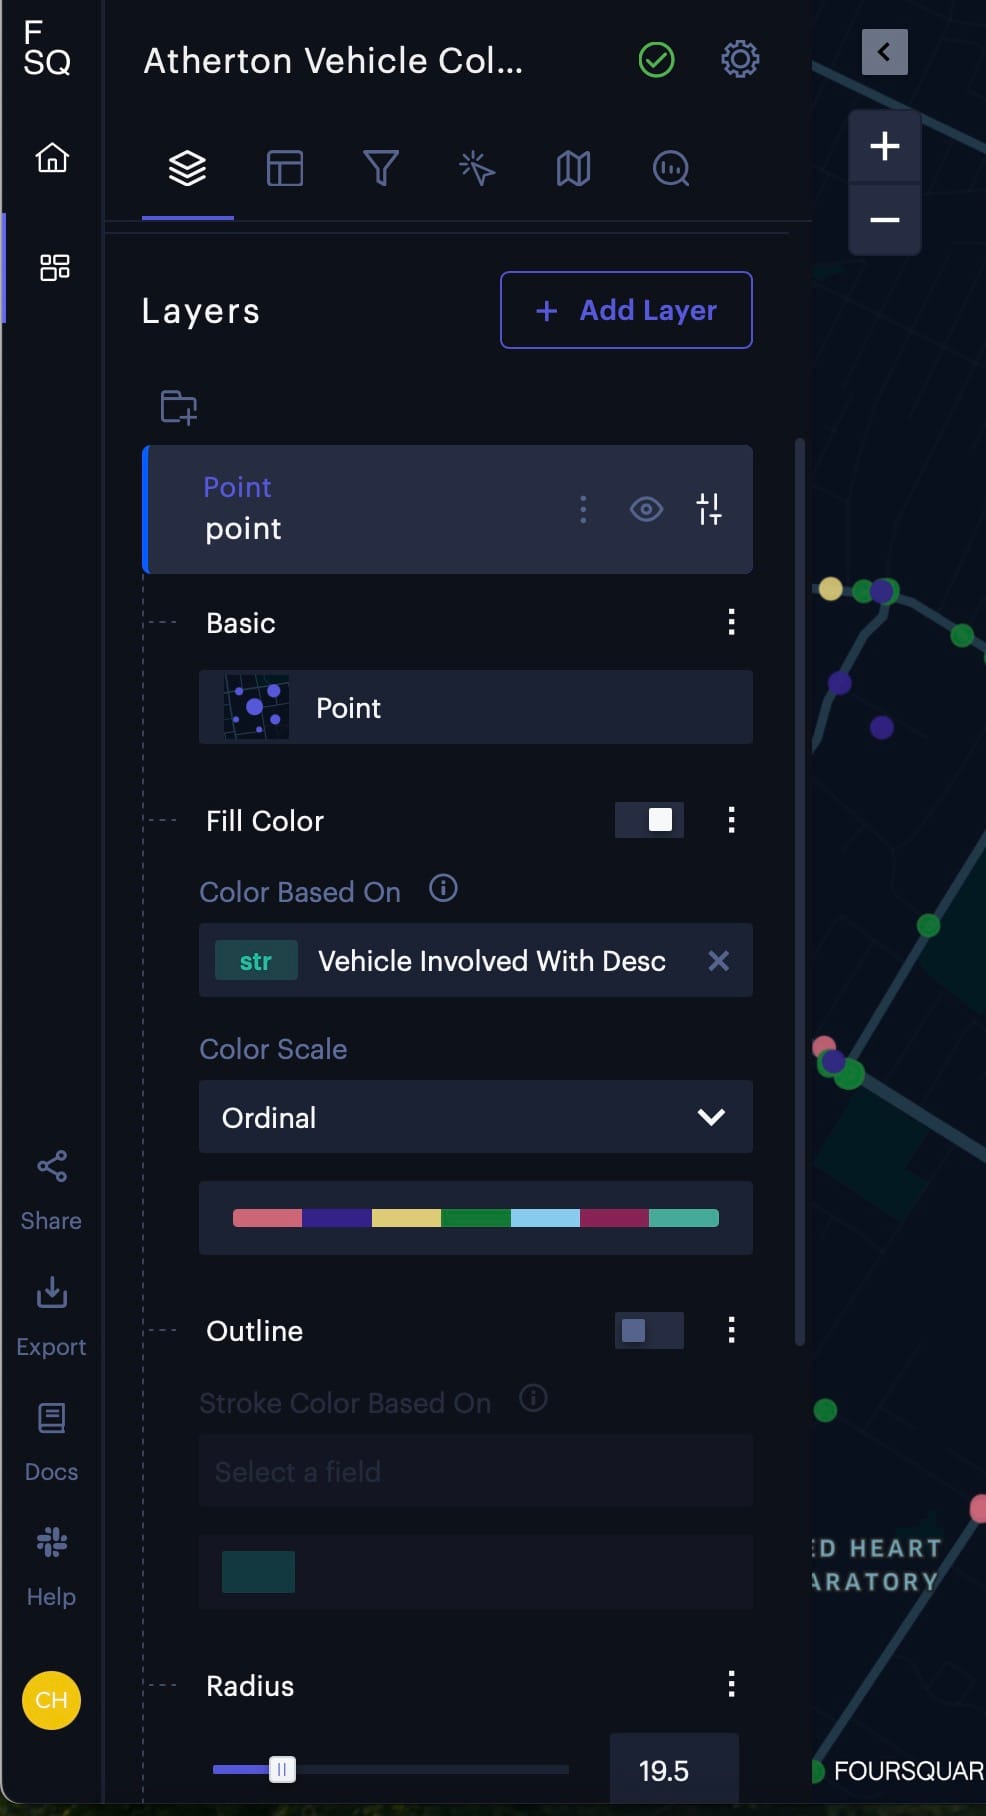
Then, under the Layers group you can set the color based on an attribute. In this case, I set the fill color based on the "Vehicle Involved with Desc" which describes whether it was a pedestrian, bicycle, other car, or object. I also adjusted the colors and the radius of the circles that appear on the map.
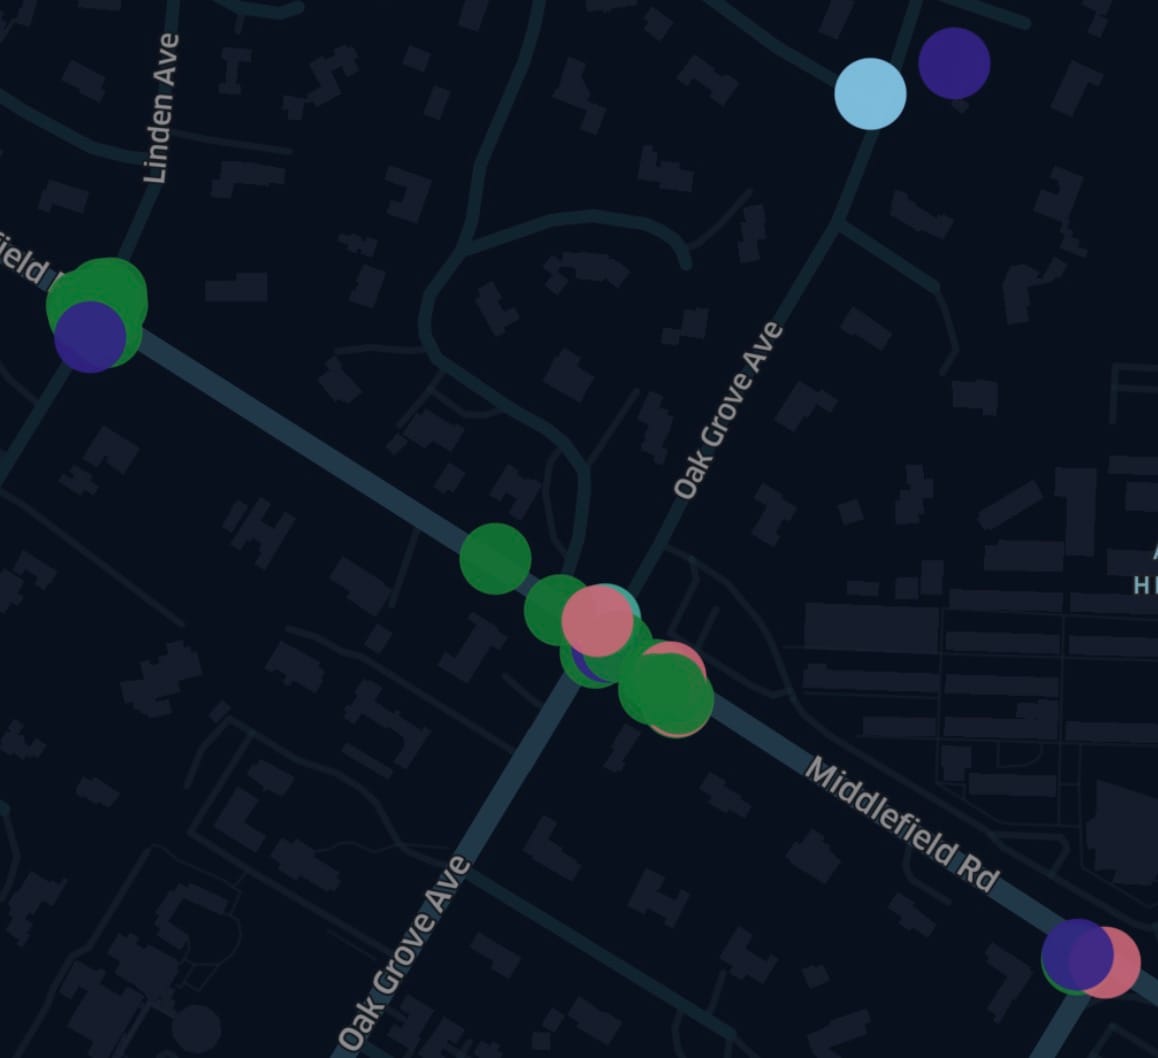
Notice how because we had applied an offset to the latitude and longitude, the circles do not entirely overlap each other. This helps the viewer visualize multiple vehicle collisions at the same intersection when they are typically labeled the same way: "Middlefield Rd / Oak Grove Ave."
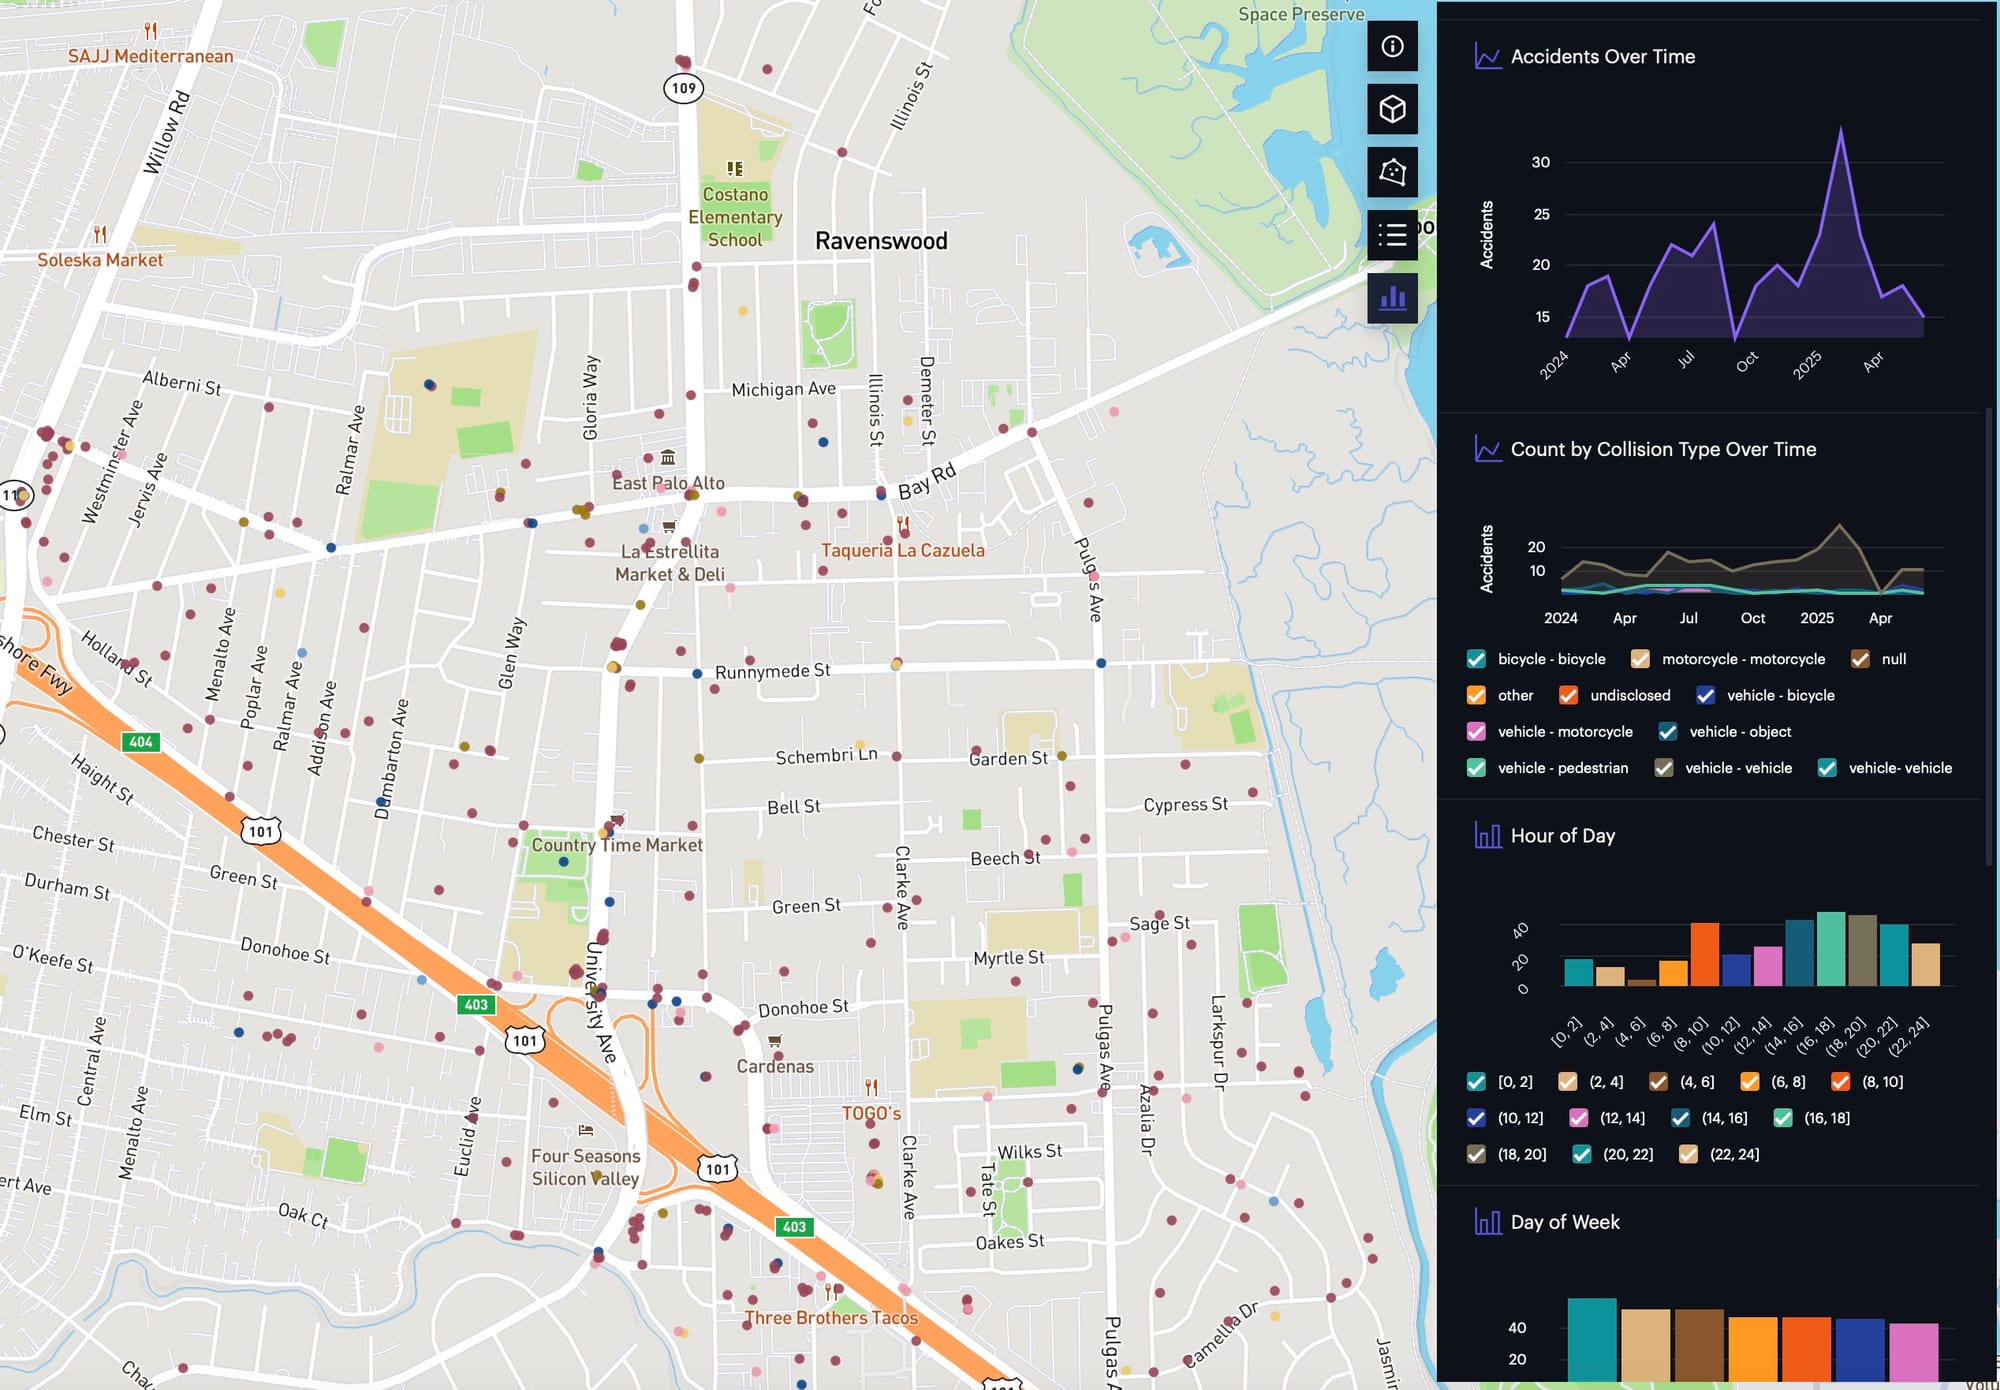
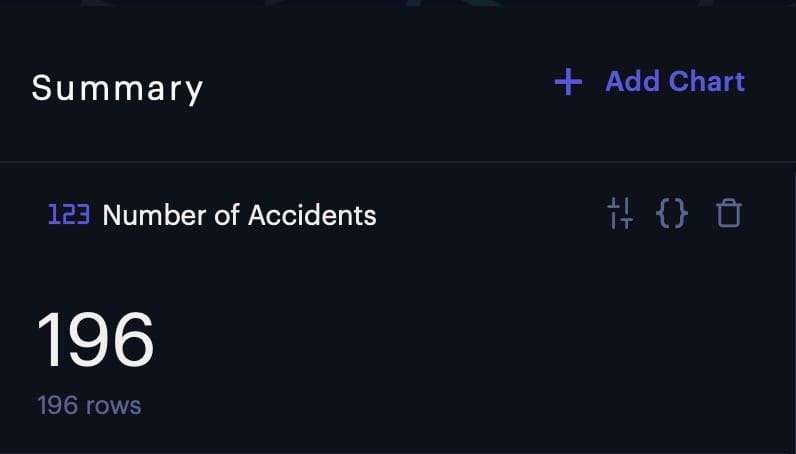
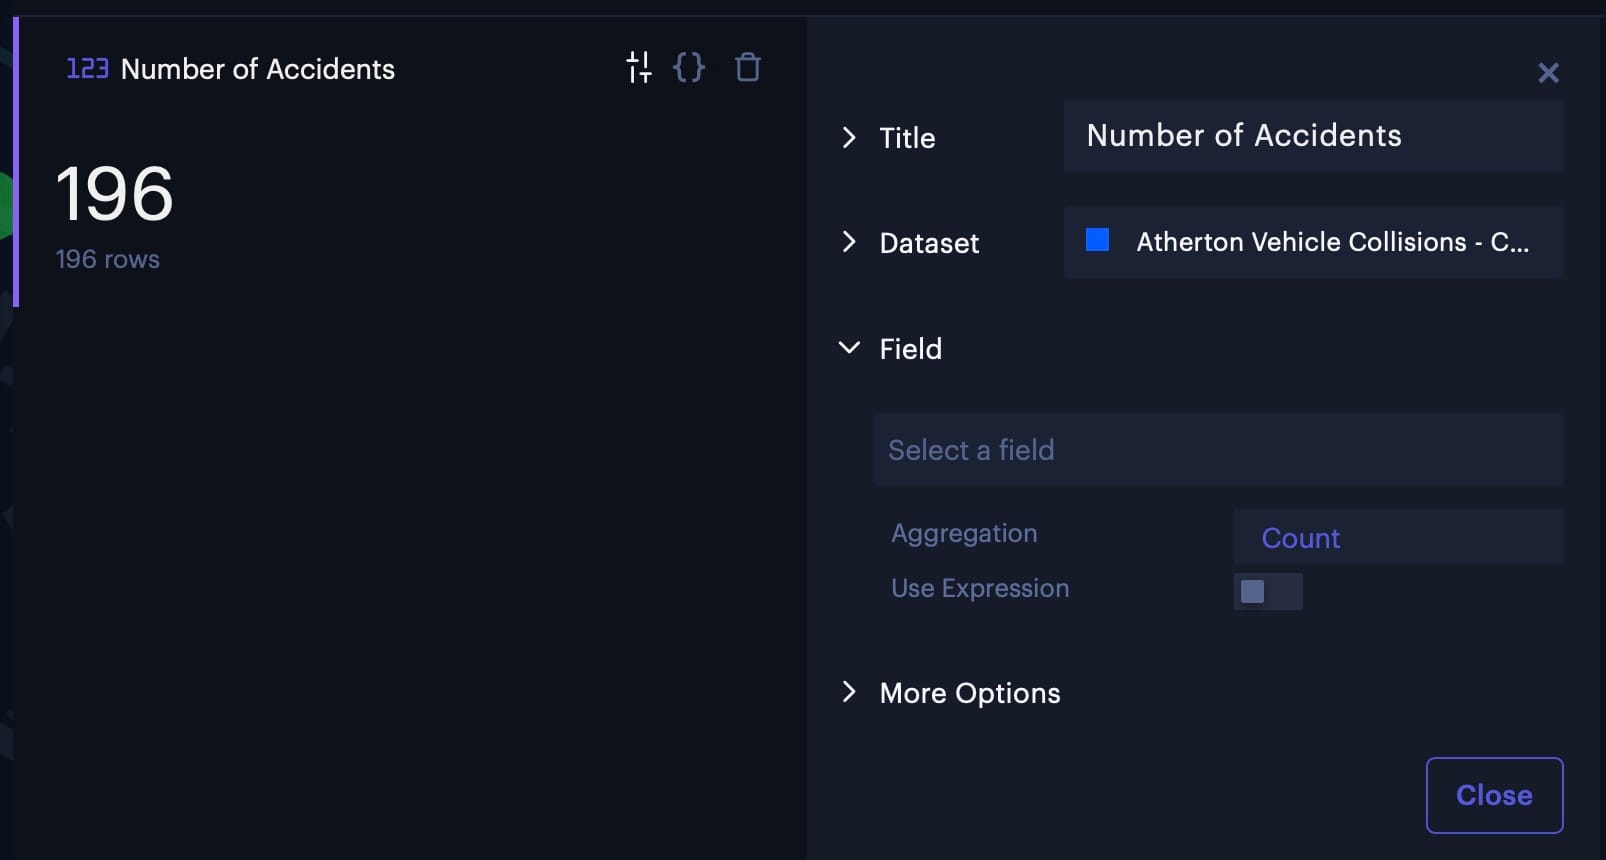
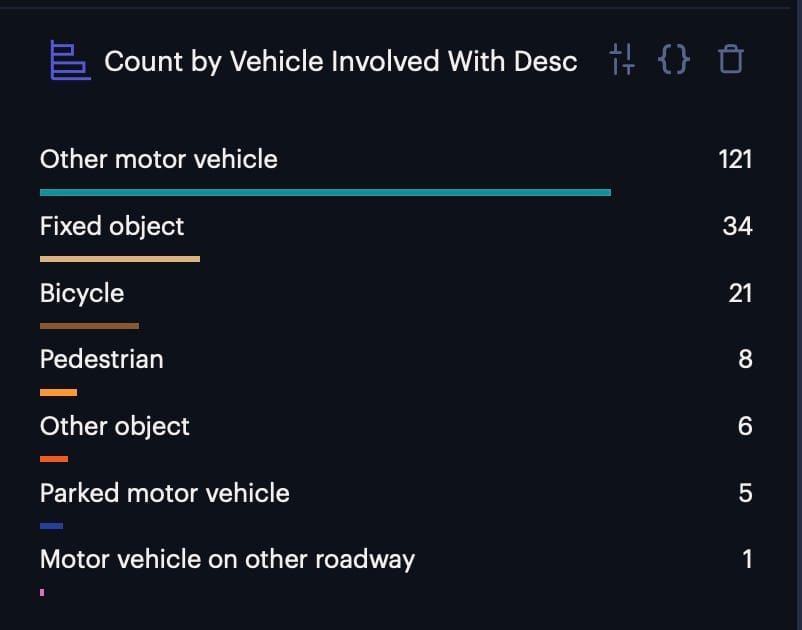
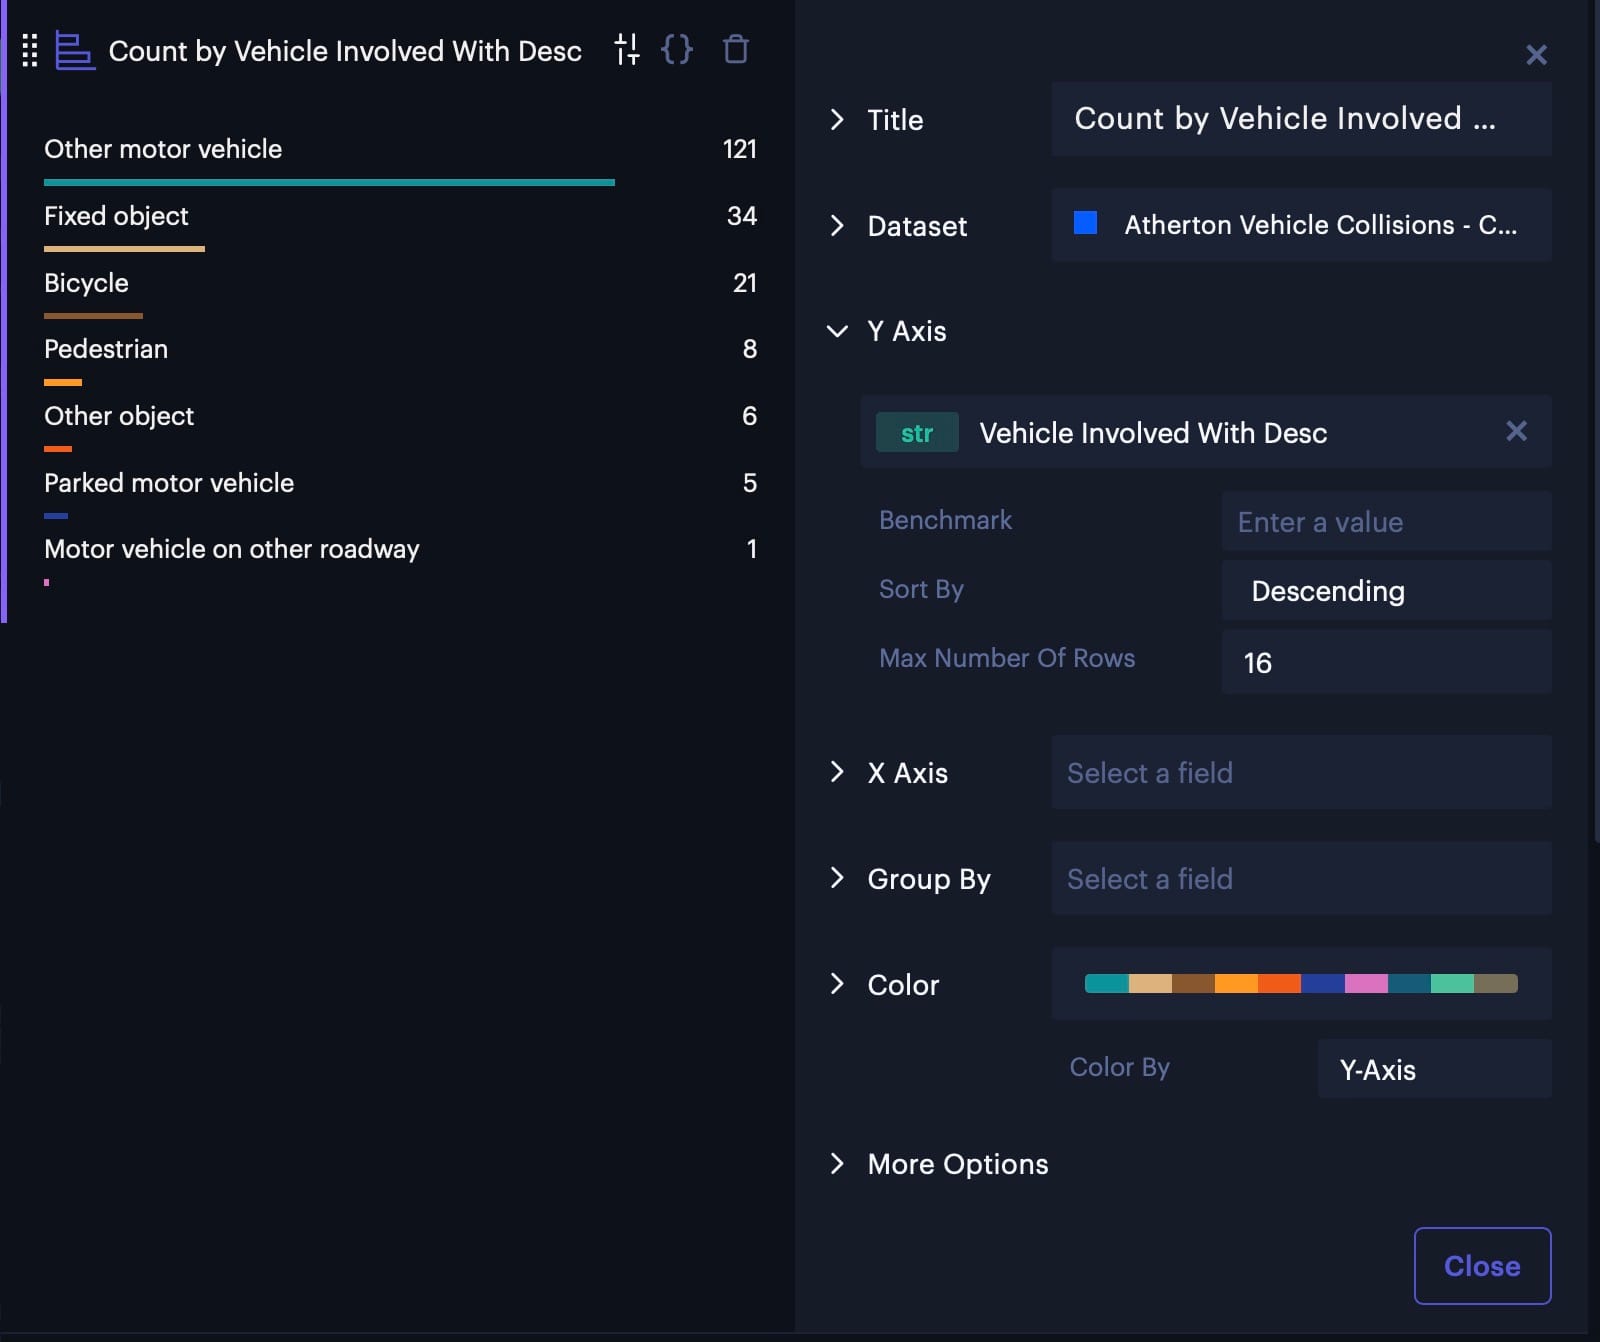
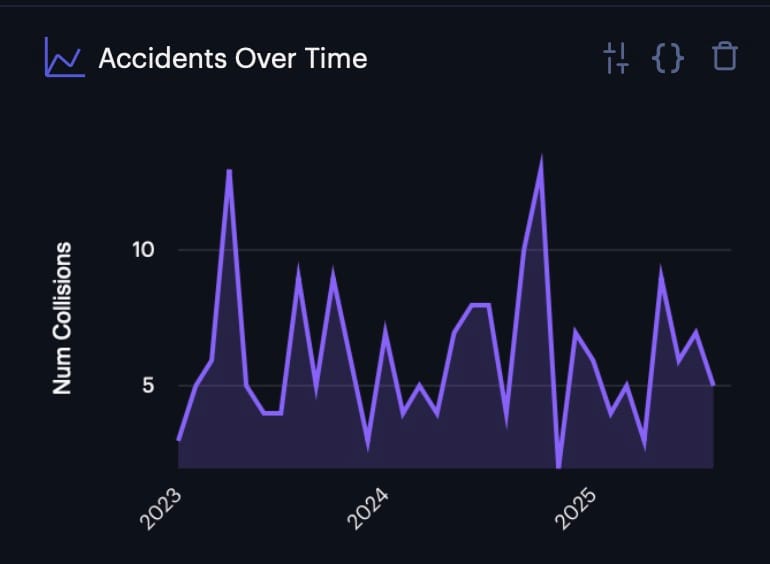
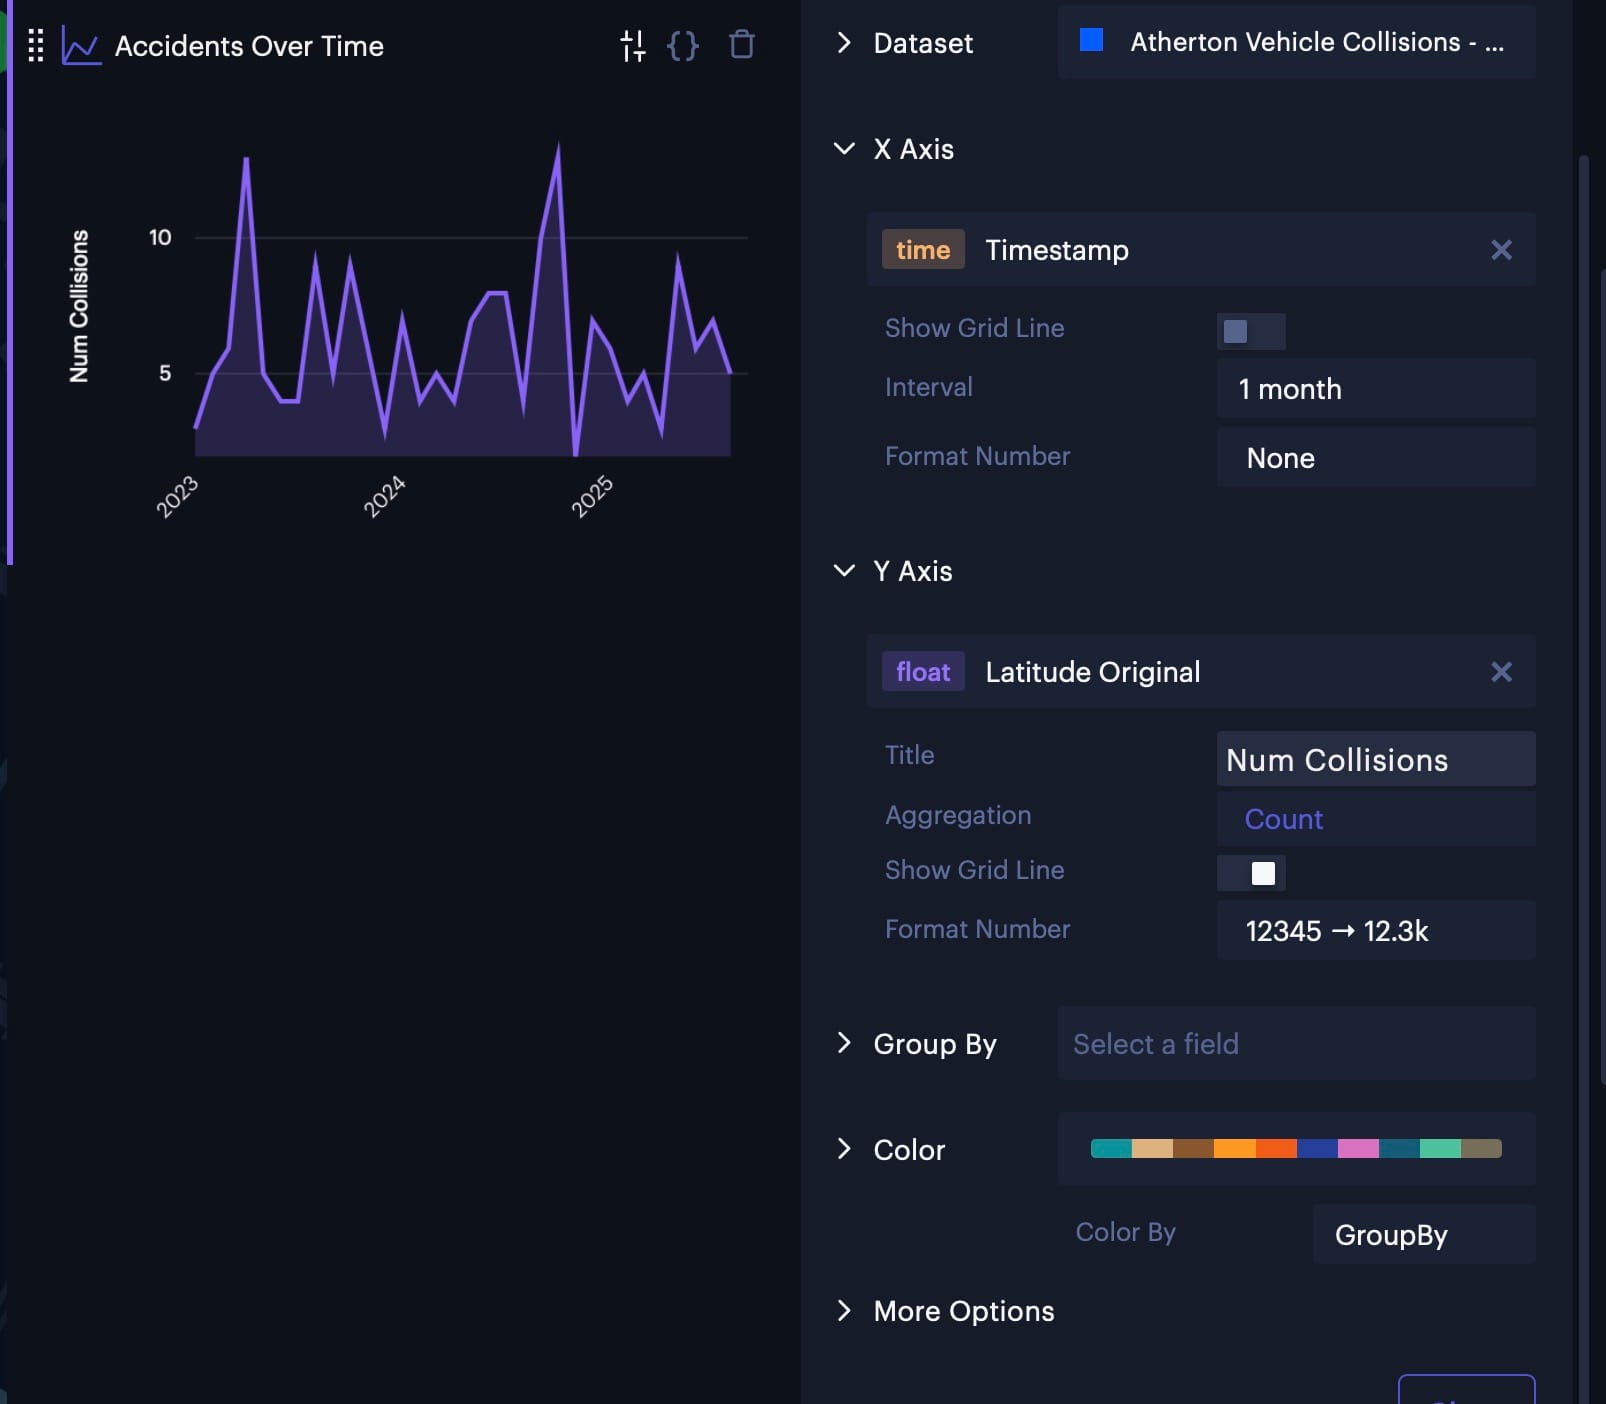
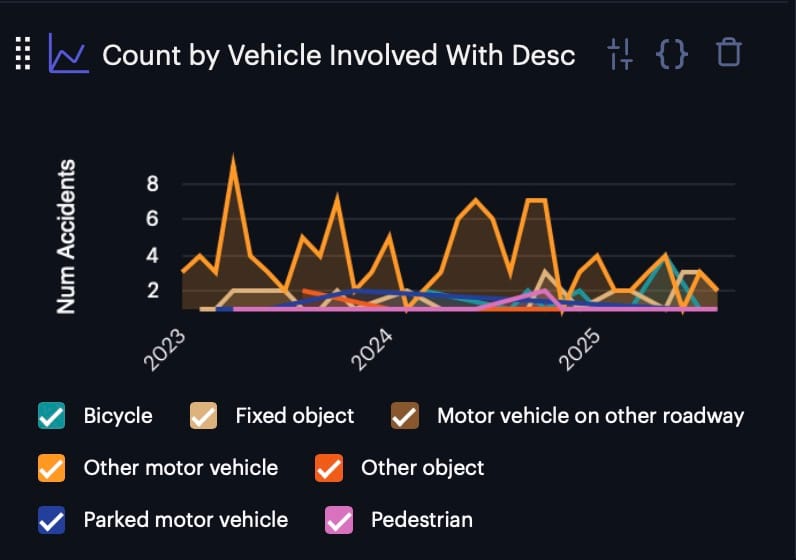
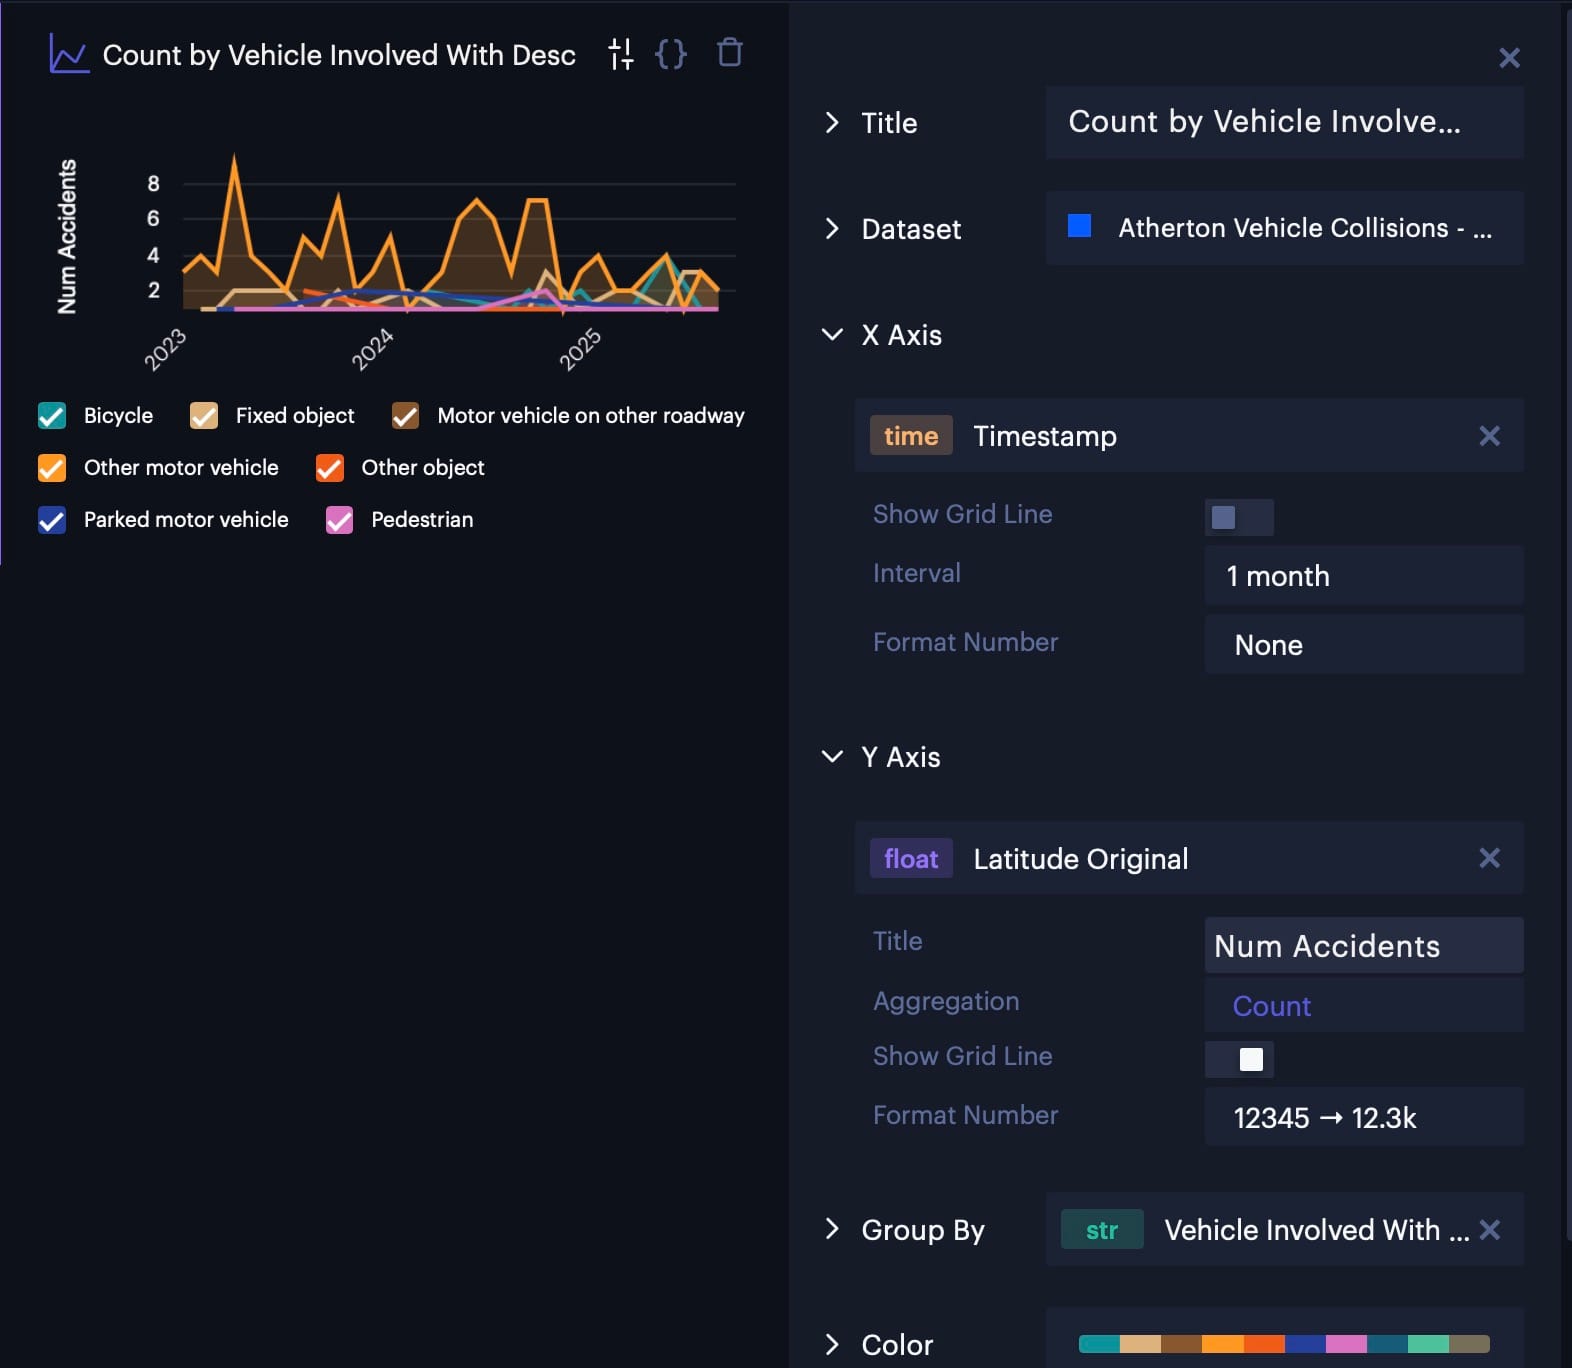
On the right hand side, I also added charts to summarize the total number of accidents, the count of accidents by collision type, a time series of the number of accidents each month, and a time series of the number of accidents each month grouped by collision type. In each gallery below, I've shown the chart and the configuration that I used to create that chart.
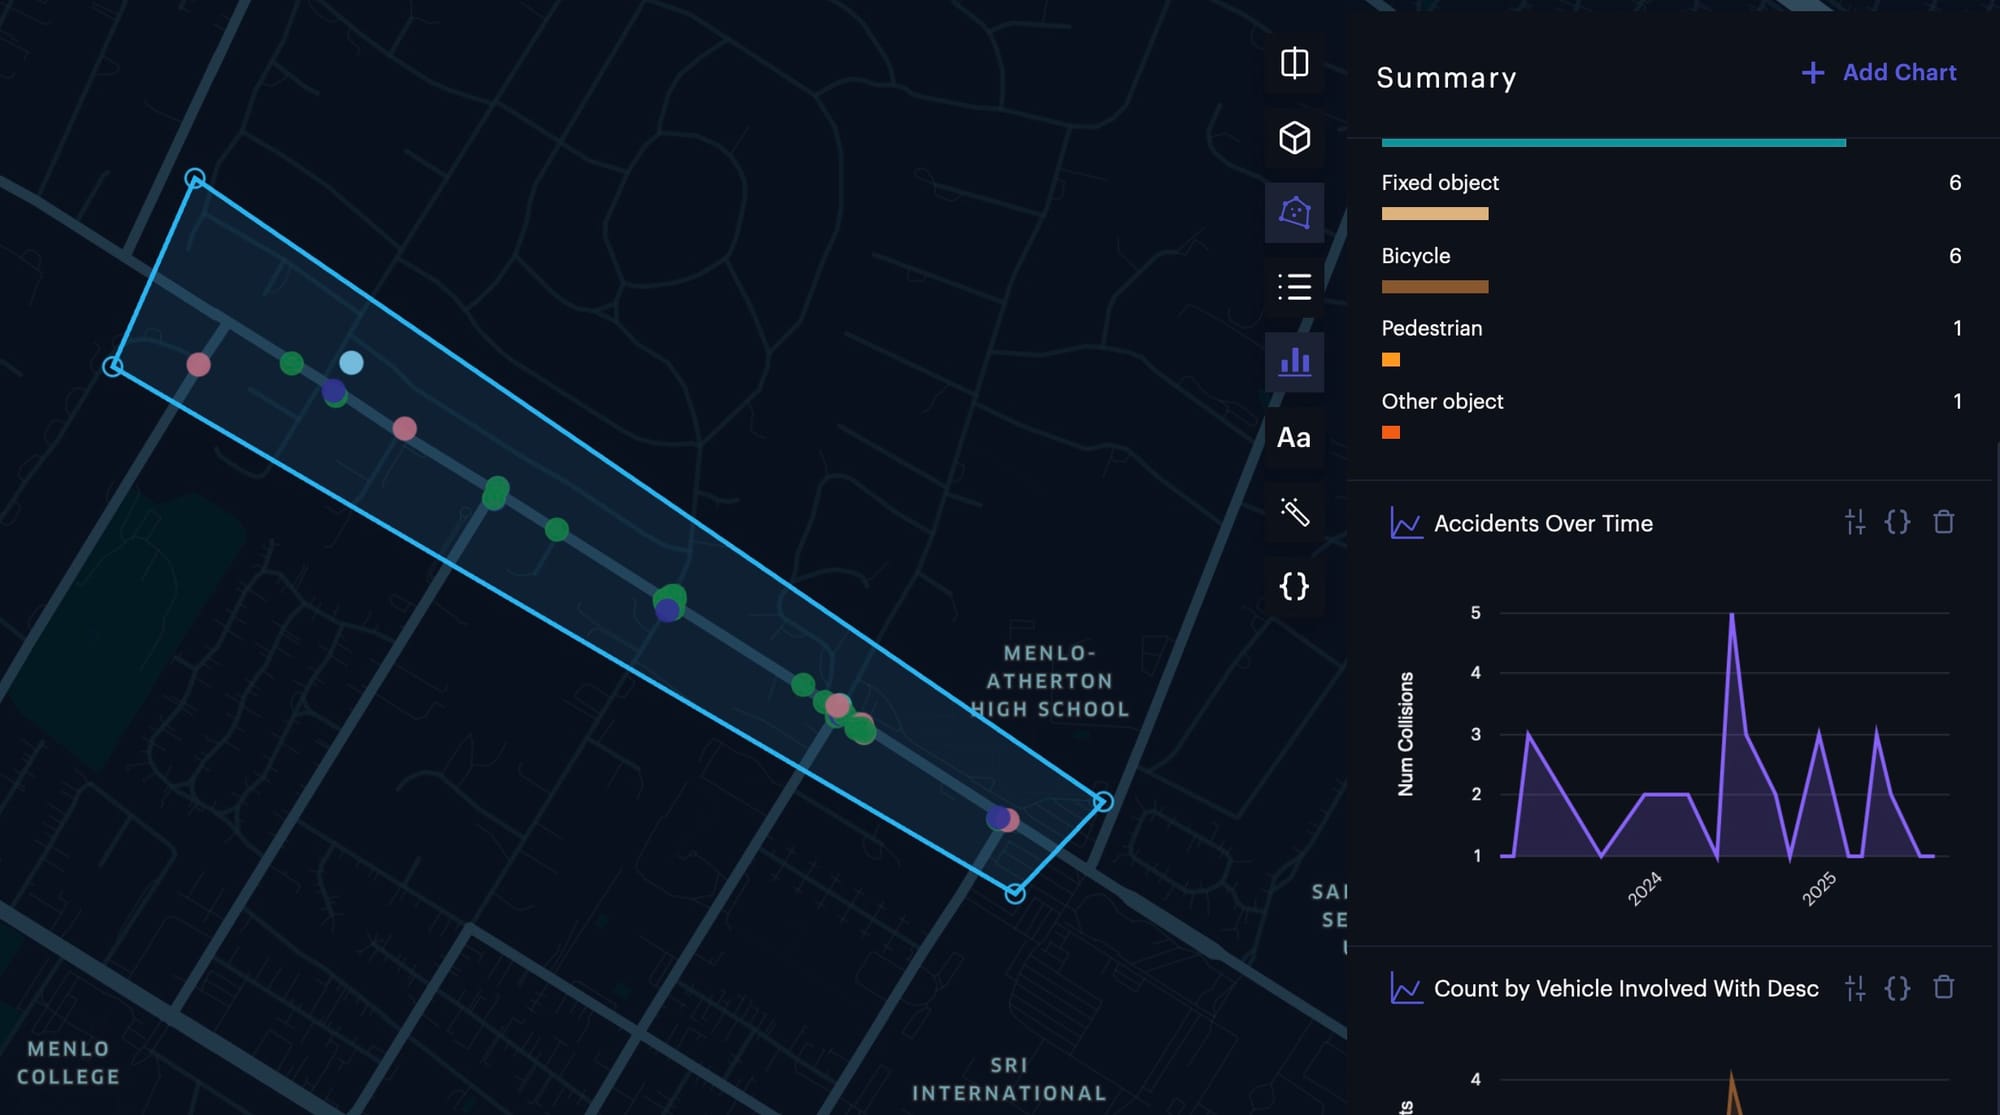
Step 5. Filter by polygon
Polygon filtering is one of the biggest reasons why I love Foursquare Studio. You can draw a polygon by clicking on the 3rd button on the top right "Draw on Map", draw your polygon, then right click -> Filter Layers -> select your layer. The charts on the right automatically update to reflect the results in that area.
I've found this feature to be incredibly helpful for a lot of my projects, and I would highly recommend using it.
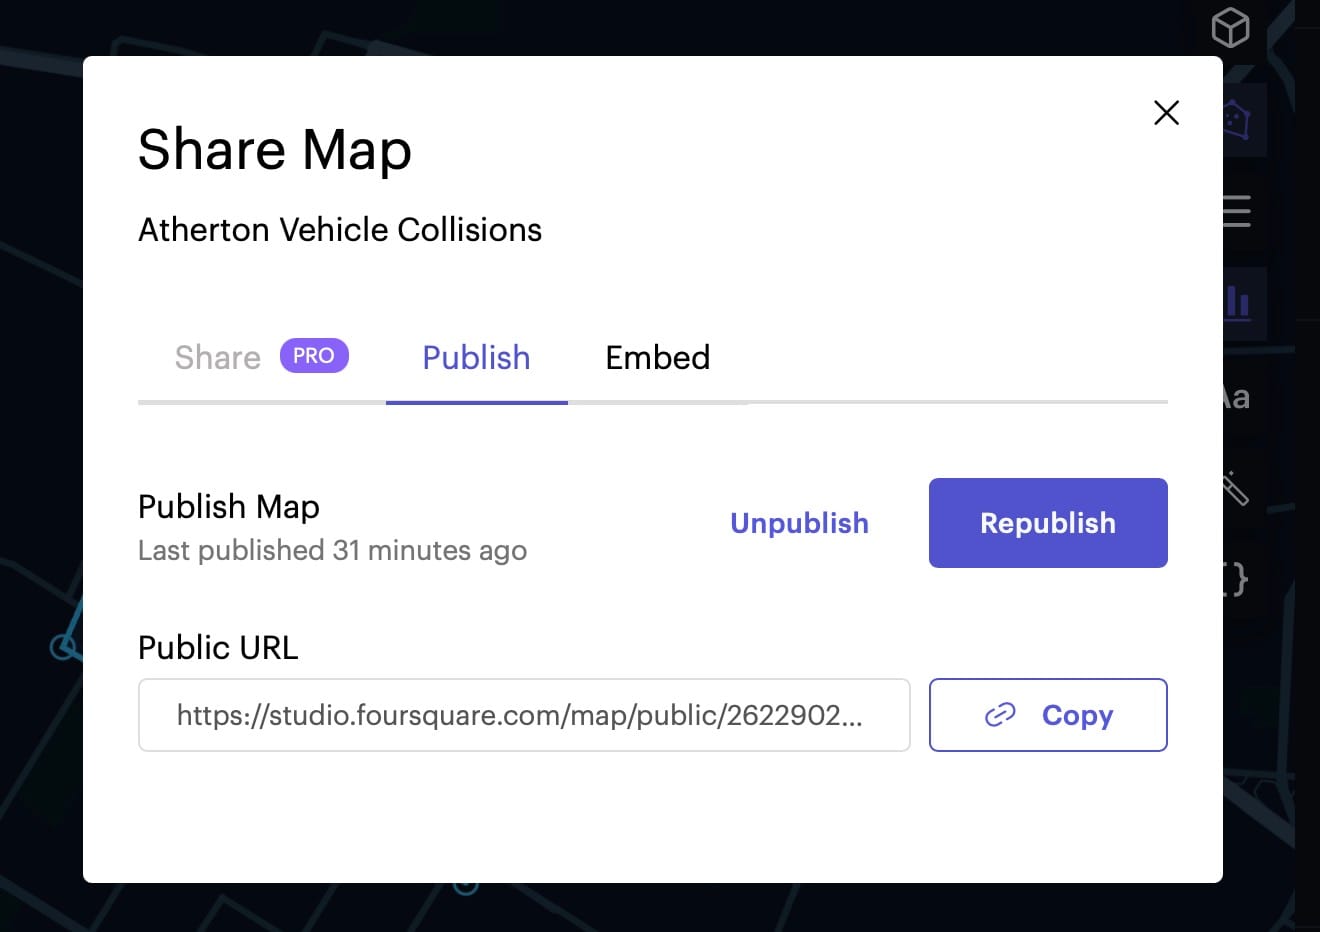
Step 6. Share
Another reason I love Foursquare Studio is that you can share your dashboard publicly. The public can make changes in the dashboard, and it won't reflect your original dashboard. Click on the "Share" button in the bottom left, then "Publish" and you will see a public URL.
Integrating Data with AI
What if you want to integrate the data with AI to build an AI chat bot?
Unfortunately, Foursquare Studio does not have a built-in AI integration.
I noticed that Kepler.gl - which you may recall is the open source project that Foursquare Studio was forked from - has a built in AI chat tool. If you want to integrate AI, it could be worthwhile to investigate there.
I've been able to bring geospatial data into AI in other projects, by creating a function tool that could call an ArcGIS REST server API to get the vehicle collisions within a certain radius or polygon defined by the user. This discussion is out of scope of this tutorial since that required using a REST server which Foursquare Studio unfortunately does not provide. Feel free to reach out and we can discuss more on that.
Conclusion
Accessing timely collision data is critical for road safety, yet it often sits locked in spreadsheets or delayed databases. By combining PRA requests, geocoding, and Foursquare Studio, we can transform raw records into interactive maps that inform policy, advocacy, and community action. This workflow is not only reproducible but also extensible—opening the door to richer analysis, AI integration, and broader applications across city data.